What is in the package
Institutional Indicators is a toolkit built on Wyckoff’s premise that large operators leave footprints: ranges they build inside, volume they absorb, levels the market keeps respecting. Each part is a StrategyQuant X block family with a compiled MetaTrader 5 indicator that follows the same specification. Parity says what has been checked and what has not.
The package contains:
- The Wyckoff engine: four core indicators, each with an SQX block and an MT5 twin (
WyckoffEventStream,WyckoffFailedStructure,WyckoffSignificantBarInversionandShorteningOfThrust), and 65 condition blocks wrapped around them, so the Builder can use an event, a phase or a level as a true/false rule. Wyckoff’s idea is that large operators accumulate or distribute inside trading ranges, and that the tell is the relationship between price, effort (volume) and result. The rules follow two published texts on the method; the books themselves are not distributed with the product. - The other indicator families: cumulative delta, TWAP, moving-average context, divergence, bar, chart and reversal patterns, support and resistance, round numbers, sessions, market structure and fourteen candle formations (see below).
- Strategy templates: eight Wyckoff templates, book-pattern templates and example strategies.
- Compiled MT5 indicators for every block in the package.
The design rule for the Wyckoff engine: a rule is a comparison where the method gives a comparison, and a number only where the method gives none. The engine therefore has few inputs, because most of the method’s rules (“volume lower than each of the two preceding bars”) are ordinal comparisons that need no tuning.
The method in brief
A trend ends when one side is exhausted. Price then moves sideways in a range while supply and demand are exchanged, and the range ends in a breakout. The indicator reads that story as a sequence of events inside a range whose boundaries are anchored when the range opens and held until it resolves.
Accumulation (the buying side)
- PS, preliminary support: the first sign that selling is meeting demand.
- SC, selling climax: the capitulation bar that ends the decline. Its low becomes the Ice, the range floor.
- AR, automatic rally: the bounce off the climax. Its high, extended by the highs made while the range builds, becomes the Creek, the range top.
- ST, secondary test: a revisit of the climax area on less effort.
- Spring: a brief break below the Ice that closes back inside, followed by a test of the shakeout.
- LPS, last point of support: a higher low before the breakout.
- SOS, sign of strength: the breakout bar above the Creek, and a back-up to the Creek afterwards.
Distribution (the selling side)
The mirror: PSY (preliminary supply), BC (buying climax), AR (automatic reaction), ST, UTAD (upthrust after distribution, the mirror of the spring), LPSY, SOW (sign of weakness) and a back-down.
Phases A to E
| Phase | What it is |
|---|---|
| A | The trend stops: the preliminary event, the climax and the automatic reaction. |
| B | Building the cause: the range is tested from both sides. It must outlast Phase A before a shakeout can open Phase C. |
| C | The shakeout (spring or upthrust) and its test. Phase B must have outlasted A for this to open. |
| D | The move out of the range: LPS and the sign of strength or weakness. Phase C must have been outlasted before a breakout can confirm. |
| E | The trend after the back-up. The range stays open while price holds the Creek. |
Reaccumulation and redistribution
A pause inside a trend looks the same as a reversal at the start. The indicator therefore reports these as context, not outcome: Reaccumulation is 1 on every bar of a range that opened while the last confirmed breakout was a sign of strength (a markup context), and Redistribution is 1 for the markdown mirror. A range opened by a buying climax inside a markup reads as both distribution (negative phase) and reaccumulation, which is the method’s own ambiguity, left for the strategy to weigh. Both stay 0 until the first confirmed breakout in the loaded history.
Event codes
EventCode is sparse: it is 0 on most bars and carries a code on the bar where an event occurs. Positive is the accumulation side, negative the distribution side.
| Code | Accumulation (+) | Distribution (−) |
|---|---|---|
| ±1 | PS, preliminary support | PSY, preliminary supply |
| ±2 | SC, selling climax | BC, buying climax |
| ±3 | AR, automatic rally | AR, automatic reaction |
| ±4 | ST, secondary test | ST, secondary test |
| ±5 | Spring | UTAD / upthrust |
| ±6 | LPS | LPSY |
| ±7 | SOS, sign of strength | SOW, sign of weakness |
| ±8 | Test of the shakeout | Test of the upthrust |
| ±9 | Back-up | Back-down |
EventPhase is different: it is a persistent signed phase held across the range, ±1 to ±5 for A to E. Use EventPhase to ask “are we inside a range”, and EventCode to ask “did this event just happen”.
Wyckoff Event Stream
The main indicator. It steps a state machine over closed bars, in order, and emits events, phases, levels, objectives and context.
How it decides
- Climax is a rank, not a ratio. A climax bar has the widest true range and the heaviest volume of the move so far, the move being measured from the last confirmed pivot, and the move must reach the mean of the recent same-direction legs. Four forms are recognised: the rank bar; several narrow bars on high volume; one bar with a long tail on above-average volume; and an exhaustion that is recognised only by its reaction.
- The range is anchored. The climax and the automatic reaction fix the boundaries, which are then held for the life of the range, and every later event is tested against them. The AR is judged against the mean of the recent same-direction legs, and twice that mean sets
ARStrength. - Tests must show volume below each of the two preceding bars. That is the method’s one hard volume rule.
- Springs are graded. Grade 3 is a one-candle penetration on volume below, and a range narrower than, the two preceding bars; it is the only grade that may be entered directly. Grade 2 is any other one-candle shakeout. Grade 1 is a terminal shakeout of two or more candles that must wait for its test.
- Creek and Ice are areas, not prices. The Creek is the AR high plus the highs made in Phase B; it widens only while Phase B runs and never tracks a rolling window. Boundary tests allow
BoundaryTolerancetrue ATRs. - A sign of strength is a significant bar that has also reached the range midpoint with no pullback below the shakeout low.
- Closed bars only. The forming bar is loaded for context but never stepped, so shift 0 does not repaint. Read shift 1 or later for the value a completed bar produced.
Inputs
| Input | Default | Range | What it does |
|---|---|---|---|
LookbackPeriod | 50 | 5–200 | Normalisation window and structure length. |
ZigZagStrength | 3 | 1–10 | Bars each side of a swing before it is confirmed as a pivot. |
ARLegs | 3 | 1–16 | How many recent same-direction legs set the benchmark for the AR and for the size a climax move must reach. |
BoundaryTolerance | 0.5 | 0.01–3.0 | Width of the Creek and Ice areas, in true ATRs. Also the stop distance beyond the boundary. |
MaxRangeBars | 200 | 20–1000 | Housekeeping: a range older than this is closed. |
SpikeATR | 0 (off) | 0–20 | Optional. A bar with true range above this many true ATRs may not stretch a forming range’s extreme or widen the Phase B boundary. |
SpikeScope | BoundaryOnly | BoundaryOnly, IncludingClimax | With SpikeATR on: also bar a spike from opening a range as a climax. |
The builder ships two ready parameter sets (50/3/3/0.5/200 and 30/2/3/0.4/150). All price tolerances are ATR multiples, so the indicator is instrument-agnostic. Warm-up is derived (the larger of LookbackPeriod and twice ZigZagStrength plus one); before it every output is 0.
Outputs
The first fourteen buffers keep their original meaning and index, so a consumer that reads by index still reads the same output. Later outputs were appended, never inserted.
| # | Output | Meaning |
|---|---|---|
| 0 | EventCode | Discrete event; sparse (0 on most bars). |
| 1 | EventPhase | Persistent signed phase, ±1…±5 for A…E. |
| 2 | ZoneTop | The Creek (0 when there is no confirmed range). |
| 3 | ZoneBottom | The Ice (0 when there is no confirmed range). |
| 4 | EventPrice | Close on an event bar, 0 otherwise. |
| 5 | StructuralPhase | Event-derived phase, sparse. |
| 6 | CHoCHTrendToRange | ±1 on the bar a range opens (change of character). |
| 7 | CHoCHRangeToTrend | ±1 on the bar the structure breaks. |
| 8–11 | Slope* | The range’s own internal drift (accumulation/distribution, bullish/bearish). Context, not character. |
| 12 | Reaccumulation | Accumulation range formed inside an uptrend. |
| 13 | Redistribution | Distribution range formed inside a downtrend. |
| 14 | SpringGrade | ±1…±3 on the shakeout bar; 3 is the only grade entered directly. |
| 15 | RangeCharacter | +1 accumulation, −1 distribution: falling volume with up bars wider than down bars reads as accumulation, the mirror as distribution. |
| 16 | TestPlacement | +1 for a test in the upper half (buyers), −1 below the climax (sellers). |
| 17 | ARStrength | 1 when the AR reached twice the recent legs. |
| 18 | Creek | The held range top; outlives the range, unlike ZoneTop. |
| 19 | Ice | The held range bottom. |
| 20 | RangeMid | Halfway between them. A sign of strength must reach it. |
| 21–22 | StopLong, StopShort | Ice less BoundaryTolerance true ATRs; the mirror above the Creek. |
| 23–24 | TargetLong, TargetShort | The vertical projection: Creek plus the range height; Ice less the range height. |
| 25 | EventLevel | The held EventPrice, so a shakeout stop can be set after the shakeout bar. |
| 26 | PFCount | Columns of the congestion’s point-and-figure chart spanning the count line: the cause, as a number. |
| 27–28 | TargetLongPF, TargetShortPF | The horizontal count objective: count line plus or minus PFCount boxes. |
ZoneTop, ZoneBottom, Creek, Ice and the stop and target outputs are 0 when there is no range. 0 is “nothing”, not a price. Treat it as empty; feeding it unguarded into a numeric vector is how a wildly wrong value reaches a model.
Two objectives, deliberately both published
The height projection (TargetLong) ignores duration: a 12-bar range and a 180-bar range of the same height project the same objective, which the Law of Cause and Effect says they should not. The count objective (TargetLongPF) uses a point-and-figure count of the congestion. Its box size is a quarter of the congestion’s own mean true range, its grid is anchored on the Ice, and the count line is the close of the last Phase C or D event before the break. The two objectives measure different things and will usually give different targets. Do not treat one as a drop-in for the other; which is right is a question for a backtest. PFCount on its own is a useful filter: “only take the break when the cause is big enough” does not depend on trusting the projection at all.
The other three core indicators
Wyckoff Failed Structure
Reports two related things: a structural failure, where price abandons the logic it had been following, and a failed breakout, where a structure that looked like accumulation or distribution fails at the decisive retest. It is an extra trace for judging the balance of power, not a standalone trade signal. Inputs: LookbackPeriod (50), ZigZagStrength (3), and LocationATR (0, off; 0–5): when set, a failure is reported only within that many true ATRs of the window’s volume-profile POC, VAH or VAL, or its VWAP.
| Output | Meaning |
|---|---|
BullishStructuralFailure | Strength: after a run of lower highs and lower lows, a swing higher-low reverses up without reaching the established structure low. Buyers are blocking the decline. |
BearishStructuralFailure | Weakness: after higher highs and higher lows, a swing lower-high reverses down without reaching the established structure high. Mutually exclusive with the bullish flag on any bar. The signal fires on the bar where the swing pivot is confirmed and does not repaint. |
FailedAccumulation | A genuine bullish breakout of the structure top (a significant bar closing beyond the range) that fails at the retest: a later bar closes back below the broken boundary within a few bars. The structure rotates distributive (bearish outcome). |
FailedDistribution | The mirror: a bearish breakout of the structure bottom that rotates accumulative (bullish outcome). |
Wyckoff Significant Bar Inversion
A significant bar is the clearest sign of institutional presence: a bar with a wider range and proportionally higher volume than the bars before it, closing in its direction (a bullish one in the upper half of its range), and closing beyond a prior resistance or support. If one candle does not clearly qualify, two consecutive candles can be merged into a composite significant bar. The sign of strength and sign of weakness are the most important significant bars.
The market is assumed to be controlled by the side whose last significant bar dominates. A control flip occurs when a bearish significant bar closes below the low of the last bullish one (sellers seize control), or a bullish one closes above the high of the last bearish one (buyers do). This is the operational form of a change of character. Inputs: LookbackPeriod (50); TodMode (Off, RelativeOrdinal, RawAndAboveNorm), which switches the volume test to relative volume against the same minute of day over TodDays sessions (20, 5–60). Time-of-day mode is opt-in because it did not show a measurable edge in testing.
| Output | Meaning |
|---|---|
SignificantBarQuality | Quality score of the significant bar. |
BullishSignificantBar, BearishSignificantBar | A significant bar in that direction. |
BullishControlFlip, BearishControlFlip | Control passed to buyers or to sellers. |
Shortening of Thrust
A direction-change pattern: in an uptrend each new high travels less distance beyond the previous high than the last one did (demand is deteriorating); in a downtrend each new low does (supply is deteriorating). What is measured is the progress of each new extreme beyond the previous same-direction extreme, not leg length. Only a trend’s own pushes make new extremes, so the run of pushes is also the trend gate: a lower high breaks the run. A signal needs at least MinImpulses pushes (three is the method’s floor) and the final thrust shorter than the previous one by SOTThreshold. Inputs: Lookback (30, 10–100), MinImpulses (3, 3–6), SOTThreshold (0.30, 0.10–0.60), ContextMode (FixedBars or Session), SessionType and SessionCount (which session to measure within), and ConfirmMode (Wick or Close: with Close, a swing reverses only when a bar closes the swing threshold away from the extreme). Only closed bars are evaluated.
| Output | Meaning |
|---|---|
SOT | The signed shortening-of-thrust signal, held from the push’s pivot confirmation until the next pivot is recorded. |
SOTEffortRegime | Compares the cumulative volume of the last two pushes. About 1.1 times or more means divergence (effort unrewarded, full weight); about 0.9 times or less means exhaustion (one side withdrawing, half weight). |
SOTPushRegime | Full weight only on more than four pushes with the shortening persisting, which the method reads as a trend too strong to fade; half weight otherwise. |
SOTConfirmation | Fires when the next opposite-direction leg covers most of the final push with elevated volume. |
Condition block reference
Condition blocks are true/false rules the Builder can drop into a strategy. Their display text follows the pattern AW WES(50,3)[1] is spring: the indicator, its two main inputs, the shift, then the test. Shift 1 is the last closed bar, which is what a live strategy should read.
Event tests
| Block | True when |
|---|---|
| Wyckoff Is Preliminary Support / Supply | The bar is that event. |
| Wyckoff Is Selling Climax / Buying Climax | The bar is that event. |
| Wyckoff Is Automatic Rally / Automatic Reaction | The bar is that event. |
| Wyckoff Is Secondary Test (and Bearish) | The bar is a secondary test on the accumulation or distribution side. |
| Wyckoff Is Spring / Up Thrust | The bar is the shakeout. |
| Wyckoff Is Sign Of Strength / Sign Of Weakness | The bar is the breakout. |
| Wyckoff Is Last Point Of Support / Supply | The bar is that event. |
| Wyckoff Event in last N bars | The chosen TargetEventCode occurred within MaxBars bars. |
| Wyckoff Last event equals | The most recent event (looking back at most MaxLookback bars) is TargetEventCode. |
Range and phase state
| Block | True when |
|---|---|
| Wyckoff In Accumulation / In Distribution | The bar is inside a confirmed range of that character (reads EventPhase). |
| Wyckoff Entering Accumulation / Entering Distribution | The first bar of such a range (an edge on EventPhase). |
| Wyckoff Is Reaccumulation / Redistribution | The range formed in a markup or markdown context. |
| Wyckoff Phase at least / at most / equals | The phase compares to the Phase parameter. |
Level tests
| Block | True when |
|---|---|
| Wyckoff Close above / below Creek | The close is above or below the held Creek. |
| Wyckoff Close cross above / below Creek | The close crosses the Creek on this bar. |
| Wyckoff Close above / below Range Floor, and the cross variants | The same tests against the Ice. |
Numeric condition blocks
Each of the four core indicators also has eight numeric condition blocks that read any of its outputs: Rising, Falling, Higher than level, Lower than level, Crosses above, Crosses below, Changes up by, Changes down by. These are how you use Creek, SpringGrade, PFCount, SOT or SignificantBarQuality in a rule.
Using the blocks in StrategyQuant X
In the Builder
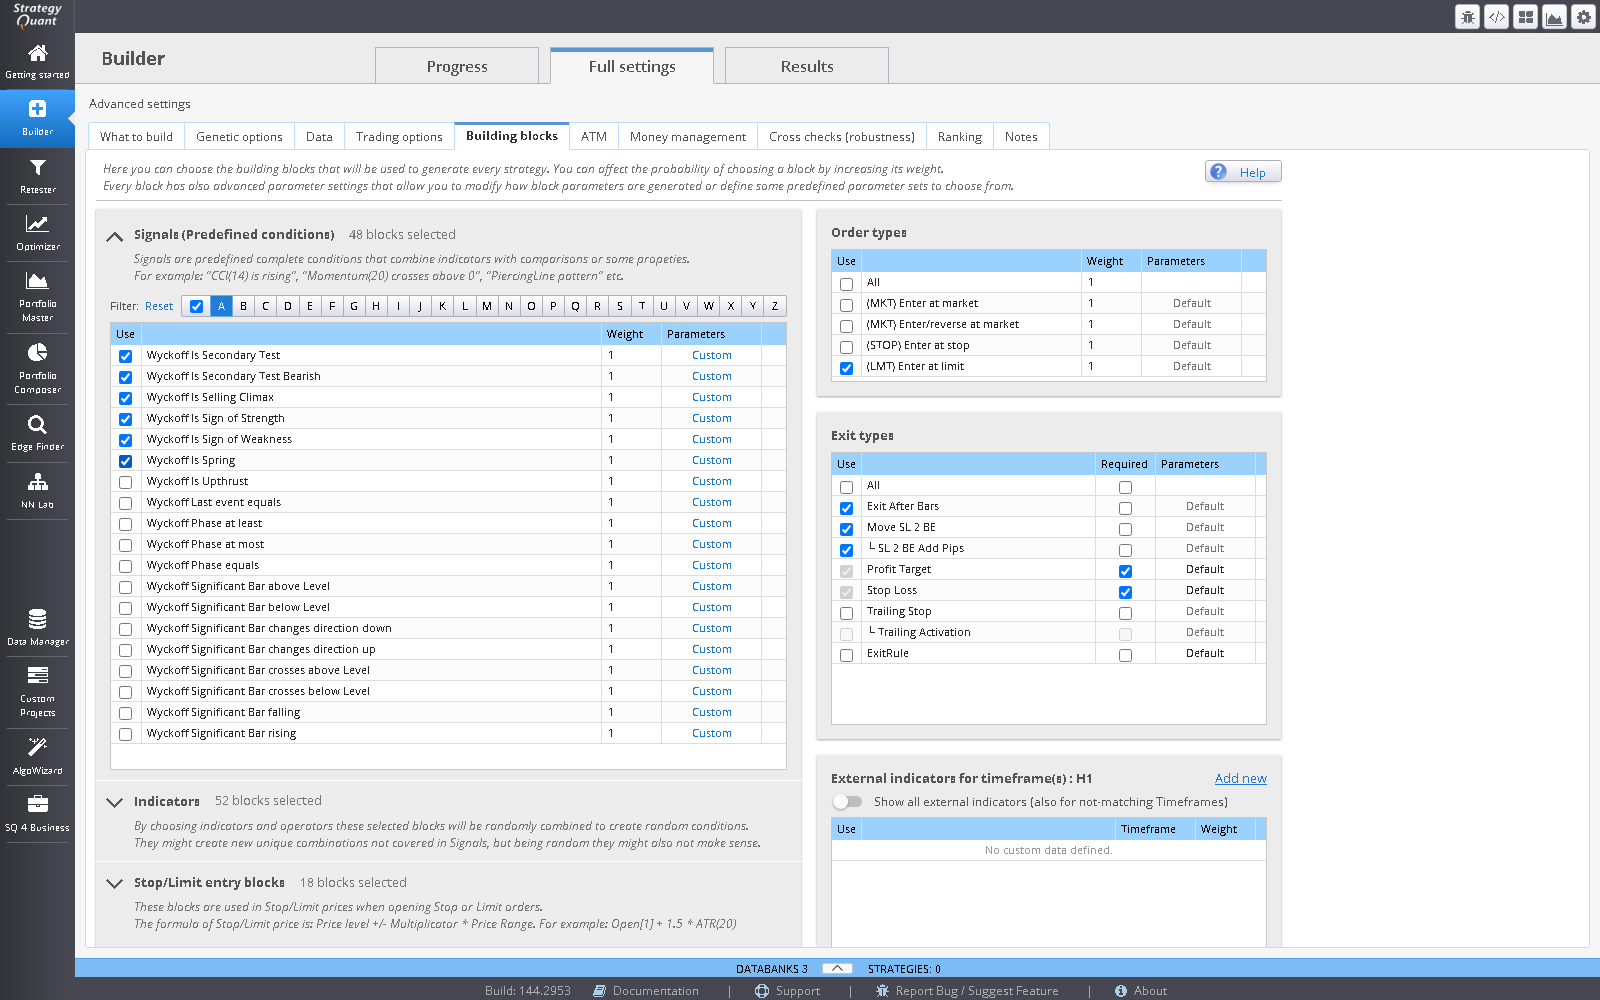
- In a Build task open Building blocks and tick the Wyckoff blocks you want the builder to sample. Start with a small set: a state block (In Accumulation), an event block (Is Spring, Is Sign Of Strength) and a level block.
- Leave the indicator inputs to the builder or pin them. The shipped parameter sets are a sensible start.
- Use Shift 1 in strategies that trade live, so the rule reads a closed bar.
- Consider the numeric outputs as exits:
StopLongandTargetLongare price levels the range already implies.
Templates and example strategies
Eight Wyckoff templates ship under Wyckoff, each with an example strategy: WYK_SpringShakeout, WYK_SOSBreakout, WYK_SOSBreakoutLevelStop, WYK_LPSBackup, WYK_ClimaxReversal, WYK_ReaccumulationContinuation, WYK_FailedStructureCHoCH and WYK_SOTExhaustion. Book-based templates and BOOK_* example strategies ship alongside. Use them as starting points for a build, not as finished strategies.
In AlgoWizard
Add a rule and pick the indicator or one of its condition blocks. The indicators expose their outputs by name, so a rule can compare Creek with a price or test SpringGrade against a level.
Using the indicators in MetaTrader 5
Each core indicator has a compiled twin: AWWyckoffEventStream, AWWyckoffFailedStructure, AWWyckoffSignificantBarInversion and AWShorteningOfThrust. They take the same inputs in the same order as the SQX blocks (the order matters to iCustom) and implement the same specification; see Parity for how the two are kept equal.
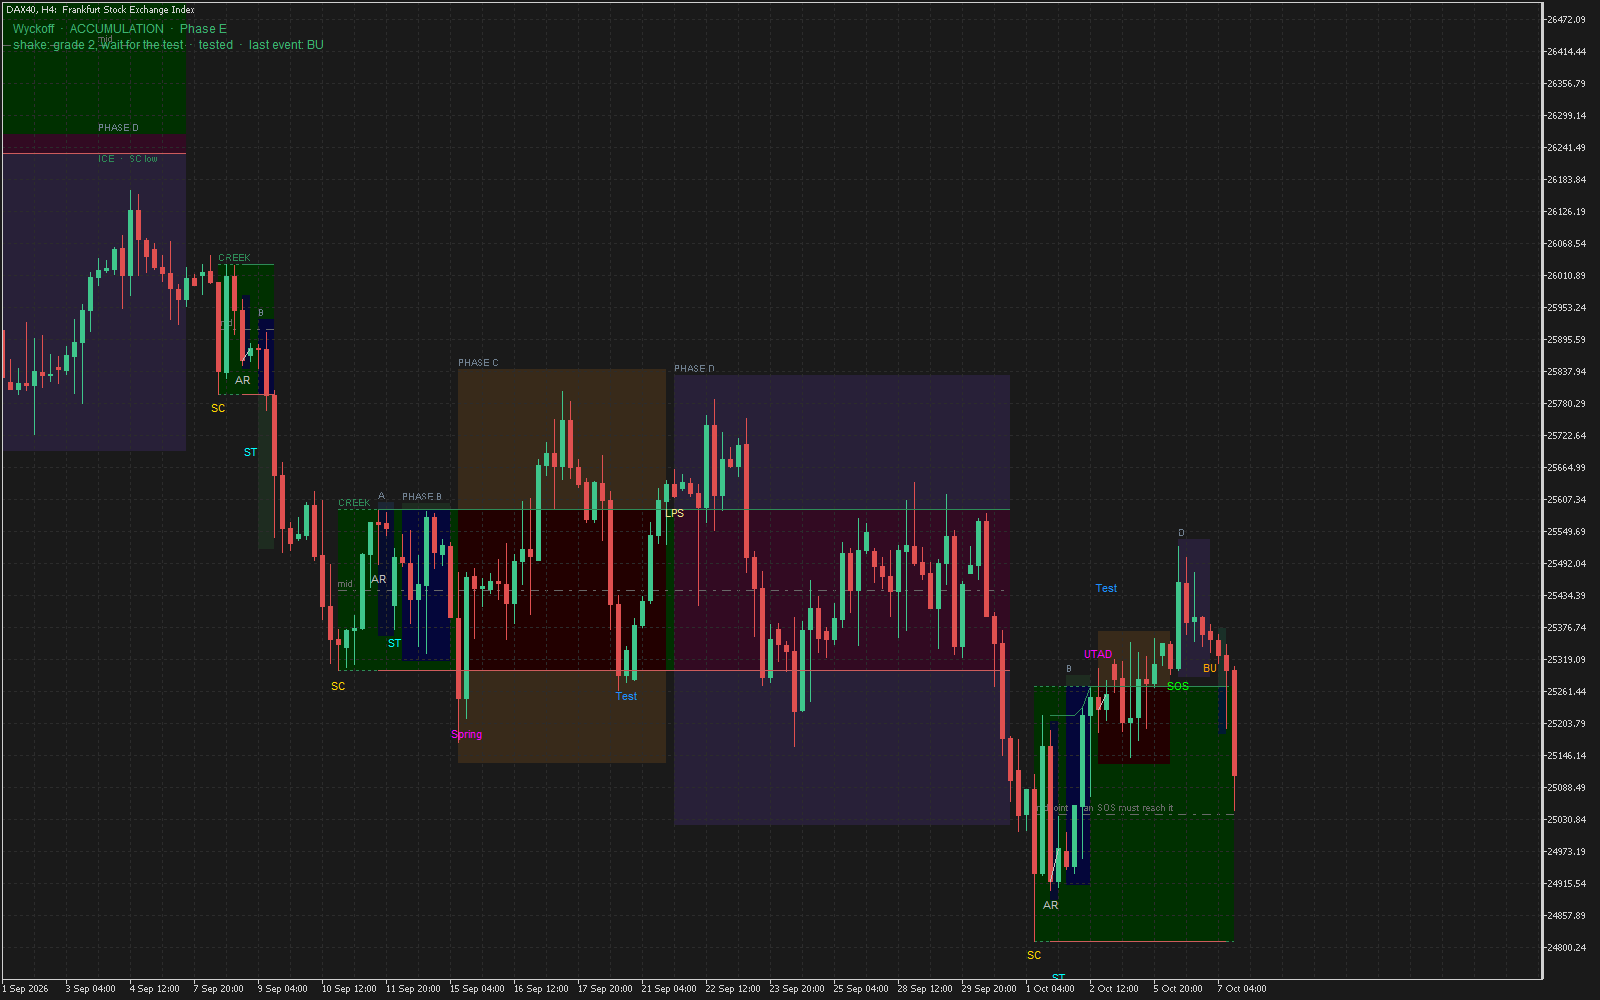
- Phase bands A–E are drawn behind the bars, captioned, one band per contiguous phase.
- Creek and Ice are drawn and named with what built each one (for example “CREEK · AR high + Phase B highs”), plus the midpoint.
- Event labels use the method’s own names: PS, SC, AR, ST, Spring, Test, LPS, SOS, BU.
- A state panel shows direction, phase letter, range character, the shakeout’s grade and whether it has been tested, and the last event.
WyckoffSignificantBarInversionandWyckoffFailedStructurelive in a separate pane but mark the price chart: significant bars, control flips, the failed swing and the rejected breakout.
Every drawing switch is display-only and is forced off in generated strategies, so a strategy never depends on chart objects. The indicators evaluate closed bars only: the just-opened bar is loaded but not stepped, and nothing advances twice for the same bar. To read a value from your own EA, use iCustom with the buffer numbers in the table above and read shift 1 or later.
An SQX-exported EA needs the AW indicators it uses in MQL5\Indicators and StrategyQuant’s own Sq* files compiled once. See Install and licence.
The other indicator families
Beyond the Wyckoff engine, the package includes these families, each with an SQX block, condition blocks and an MT5 indicator. They are useful on their own and together with the events above.
| Family | Blocks | What it gives you |
|---|---|---|
| Cumulative Delta | Cumulative Delta + Flow Pressure, and 10 condition blocks | A tick-volume and price-flow proxy for order flow (it is derived from bars, not from a real order-book feed). Absorption detected, absorption then initiative up or down, bullish and bearish divergence, buy and sell pressure regimes, initiative detected, control retest long and short. |
| TWAP | (TWAP) Time Weighted Average Price, plus rising, falling, higher, lower, cross and change blocks | A time-weighted average price over a period, usable as a level. |
| Moving average | Custom Moving Average; (MA) Moving Average Context Data and Context; bar closes or opens above or below | A configurable average and condition blocks around where a bar opens and closes relative to it. |
| Divergence | (DIV) Oscillator Divergence | Regular divergence between price pivots and an oscillator, selectable between CCI, RSI, MFI, Stochastic %K and the standard MACD histogram, evaluated at the same confirmed price pivots. |
| Flow | (SLOPE) Normalised Series Slope; (MFI) Money Flow Index | The slope of a series in ATR units, and money flow. |
| Patterns | (BAR) Bar Pattern; (PAT) Chart Pattern; (REV) Reversal Pattern; (SW) Second Wind | Inside bars and similar; chart patterns with directional breakout-retest outputs; reversal patterns with a neckline; the second-wind trigger level. |
| Round numbers | (RN) Round Number Levels | The nearest round-number level. |
| Session | (1234) Consolidation at Session Extreme; (OR) Opening Range and Session Levels | Break levels after a consolidation at a session extreme; the opening range and session highs and lows. |
| Structure | (SR) Support and Resistance Levels; (STRUCT) Trend Structure Break | Nearest levels with age, touch strength, broken-level retest quality and confluence with the round-number grid; trend-structure breaks. |
| Market structure | (SMC) Market Structure Signal and Market Structure and Liquidity | Breaks of structure and changes of character, liquidity sweeps through a confirmed swing, three-candle fair-value gaps and unfilled retests, and order-block retests after an ATR-sized displacement. Pivots require completed bars on both sides. It deliberately does not label accumulation, distribution or springs, so it is not a second Wyckoff model. |
| Extended oscillators | (OSC) Extended Oscillator Conditions | Re-entry from extremes, failure swings, lookback highs and lows, percentile rank, z-score extremes, consecutive midline holds and N-bar slope for CCI, RSI, MFI, Stochastic %K and the MACD histogram. Rank and z-score statistics use prior bars only. |
| Candles | 15 blocks | Morning and Evening Star, Bullish and Bearish Harami and Harami Cross, Three White Soldiers, Three Black Crows, Tweezer Bottom and Top, Three Inside Up and Down, Rising and Falling Three Methods. Each is a fixed-identity true/false block. Native SQX patterns (engulfing, doji, hammer and so on) are not duplicated. |
As with the core indicators, price tolerances in these families are ATR multiples, and condition blocks have a Shift parameter: use 1 so a live strategy acts only after a candle has closed.
Parity: what is checked, and how
The SQX blocks and the MT5 indicators are two implementations of one specification, so agreement is checked rather than assumed. The checks show agreement between the two implementations. They say nothing about trading results.
- Bar-by-bar comparison. The compiled MT5 indicator and the SQX Java block are run over the same history and every output buffer of every closed bar is compared, over ten parameter variants. This full comparison was run for the four core Wyckoff indicators on S&P 500 H1. The other families pass SQX’s Indicator Tester, and a stricter check on sparse outputs matched once about 100 bars of state warm-up were allowed for.
- One call per bar. SQX calls an indicator at a bar’s open with a provisional forming bar. The state therefore sees every closed bar exactly once, in order, and a bar that is genuinely flat (quiet M1, a holiday close) is stepped once, with its own row reading 0, so it cannot be lost.
- Tie handling on forex. Rules are strict ordinal comparisons, and five-digit quotes tie often. Two prices closer than 1e-9 of the price are treated as the same price on both platforms, so a one-ulp difference between a CSV import and MT5 cannot decide a tie differently and rewrite every later range.
- Held levels.
Creek,IceandEventLevelare held across bars, so SQX and MT5 agree on them from the first re-anchor after each begins, not necessarily on the first bars of a freshly loaded window.
Limits and what to expect
- Events are interpretations. The method is discretionary at heart. The indicator applies one consistent set of rules, and a human reader will sometimes label the same chart differently.
- Events print late by construction. A range is anchored when its climax and AR are confirmed, which needs later bars. A rule built on an event can only act after the confirming bars close.
- Order flow is a proxy. Cumulative Delta uses bar data, not a depth-of-market feed.
- No result is promised. Whether a Wyckoff event has edge on your instrument is for your own testing to decide. Edge Finder’s Block Edge can measure the blocks as entry filters before you build.
- Changing inputs changes the ranges. Event counts and densities move with
LookbackPeriodandZigZagStrength; any study built on one setting has to be re-run on another.
Troubleshooting
| Symptom | Cause and fix |
|---|---|
| Wyckoff blocks are missing from the Builder | SQX compiles blocks at start; restart and wait for the first launch to finish. A block that fails to compile is absent, and the SQX log says why. |
| Every output is 0 | Before the warm-up bars are loaded, or no confirmed range yet. ZoneTop, Creek and similar outputs are 0 outside a range by design. |
| MT5 and SQX differ on the first bars of a window | Held levels agree from the first re-anchor after they start. Compare over a longer window, or after the first range opens. |
| Strategy exported to MT5 stops with “cannot load indicator” | The AW indicator or the Sq* indicators are not in MQL5\Indicators. See Install and licence. |
| Almost no events | A short history or a large ZigZagStrength. Events are sparse by design; use a longer history. |
| A signal appears on the live bar and vanishes | Read shift 1 or later. The forming bar is never stepped. |