Market bias
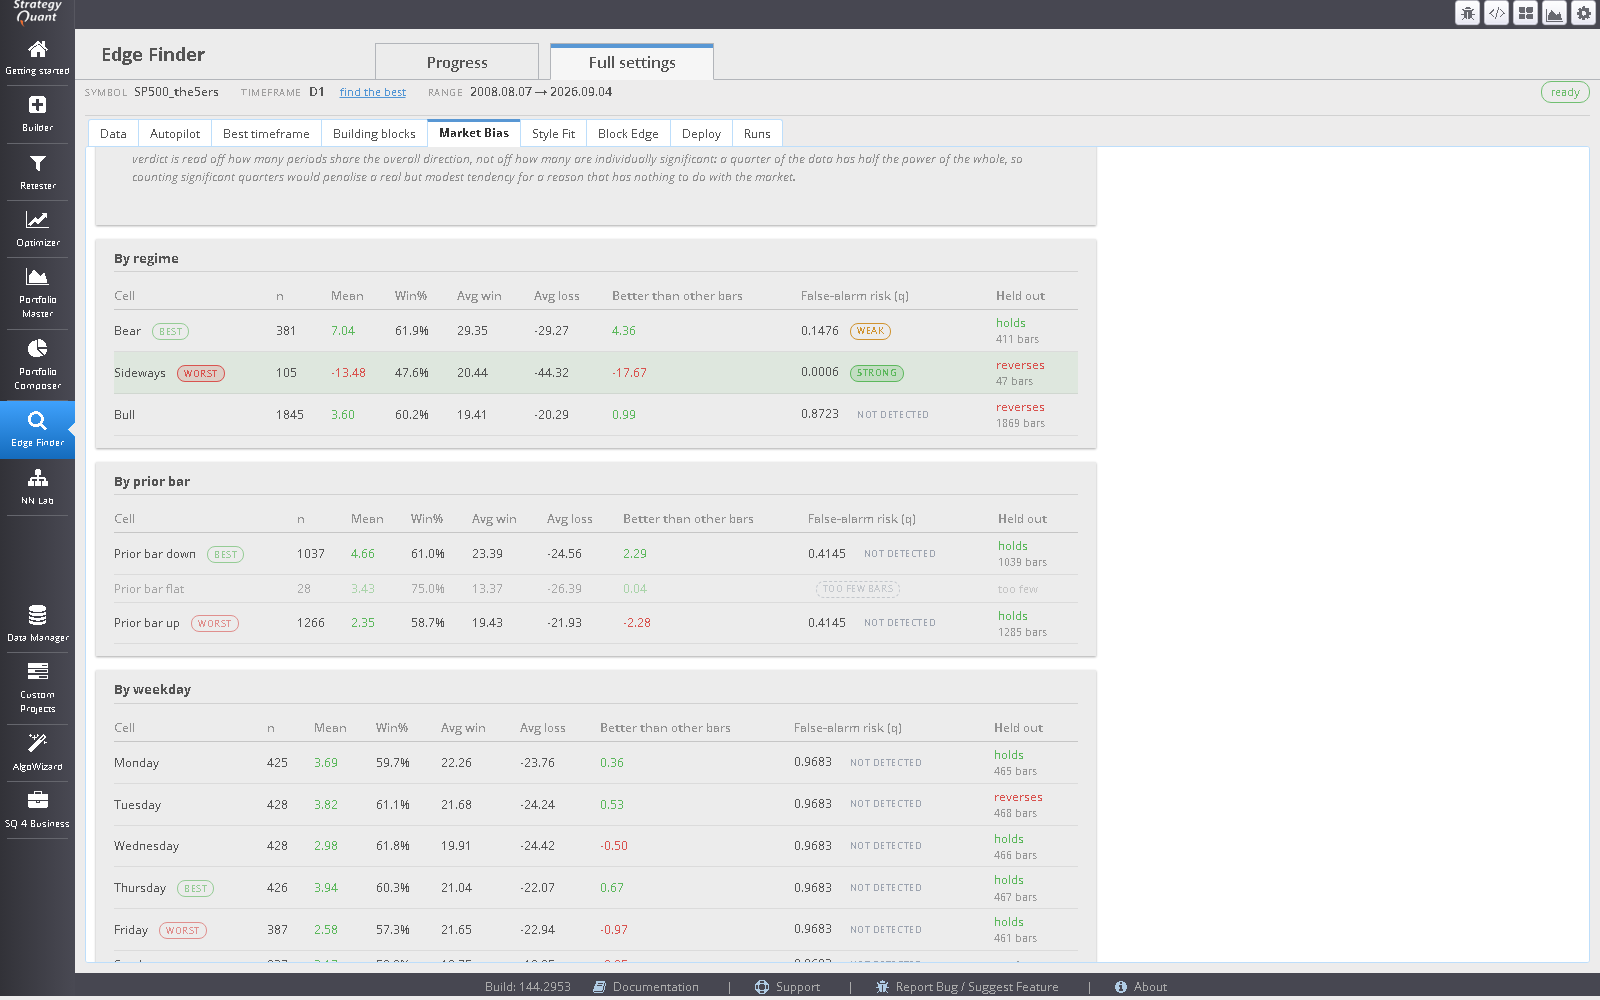
Is there a long or short tendency, and when both sides are used, do they behave symmetrically? Long and short are measured as independent populations.
A StrategyQuant X app that answers three questions deterministically: which side and symmetry setting a symbol and timeframe should be built with, which trading style the market rewards, and which building blocks carry a measurable tendency. The answer is written back into a real Build task.
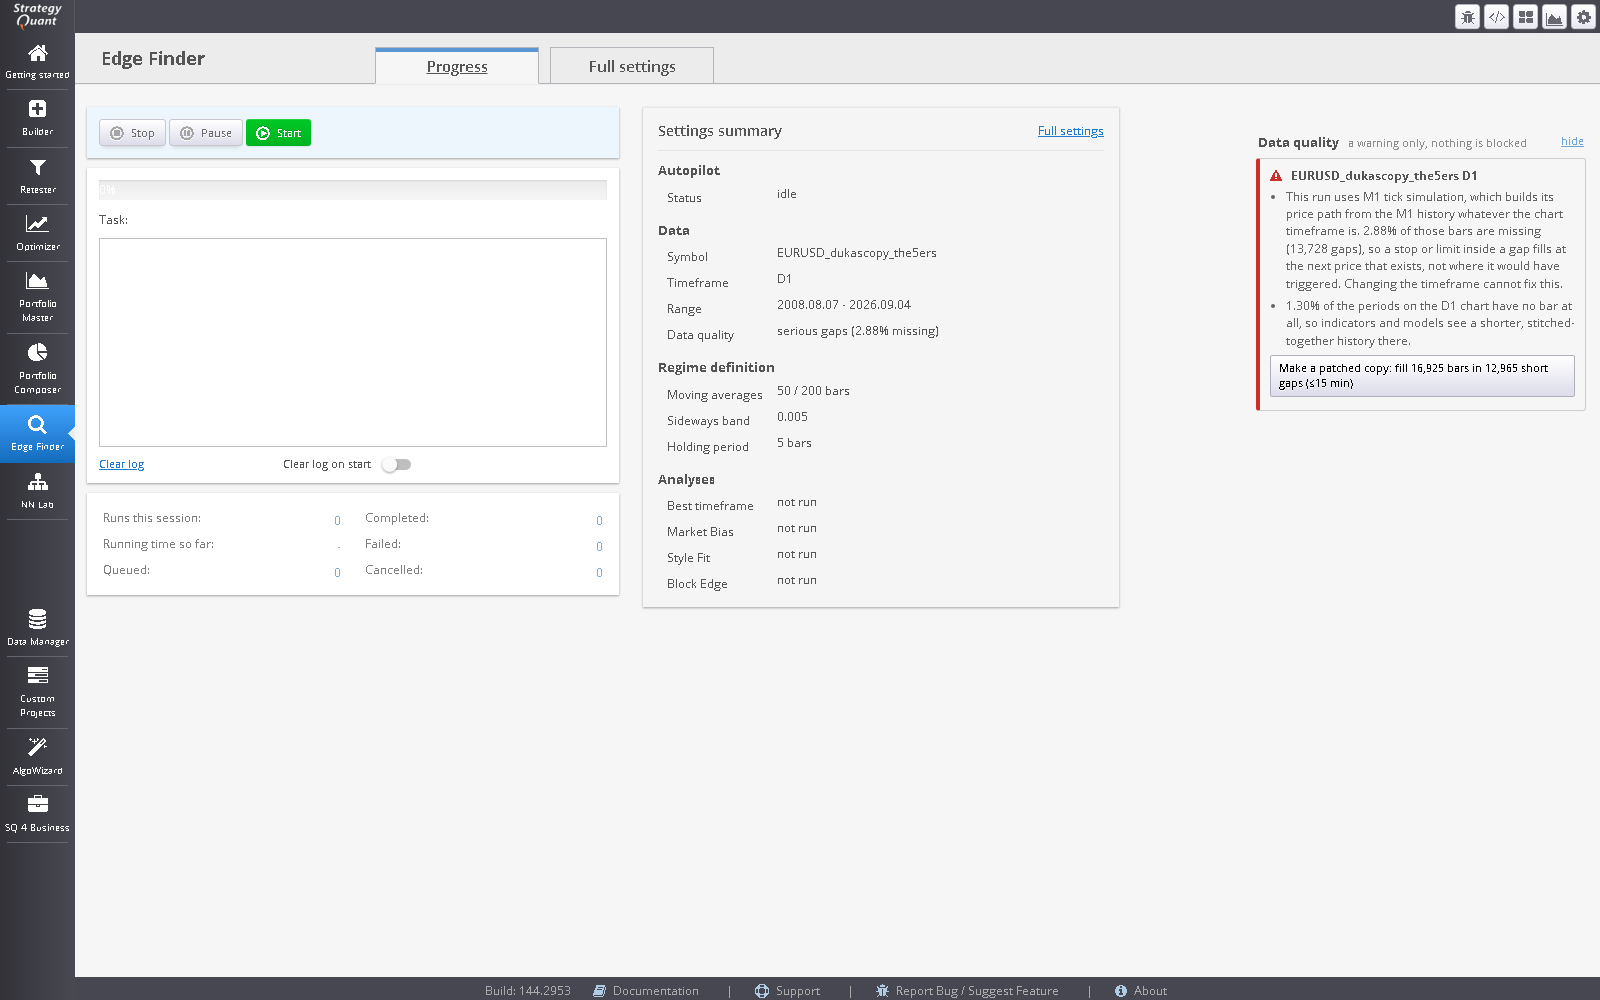
A bias figure measured on history with holes is a figure about a different market. Edge Finder checks the symbol on the Data tab every time you open the module or change the setup.
It never blocks a run. If the history has gaps, a Data quality panel on the module’s Progress, Data and Autopilot views says how many minutes are missing and why it matters for the precision you chose, and offers one button, Make a patched copy. That fills short holes (up to 15 bars) with flat, zero-volume bars at the previous close, imports the result as <symbol>_patched and leaves the original untouched. Longer outages are reported and left alone. Every filled minute is written to an audit log. This is a light version of GapSmith: the same fill rules, built into this module for the symbol on its Data tab. GapSmith itself adds a Fix gaps button to the Data Manager’s Analyze data quality view, for any symbol, without needing this module.
Is there a long or short tendency, and when both sides are used, do they behave symmetrically? Long and short are measured as independent populations.
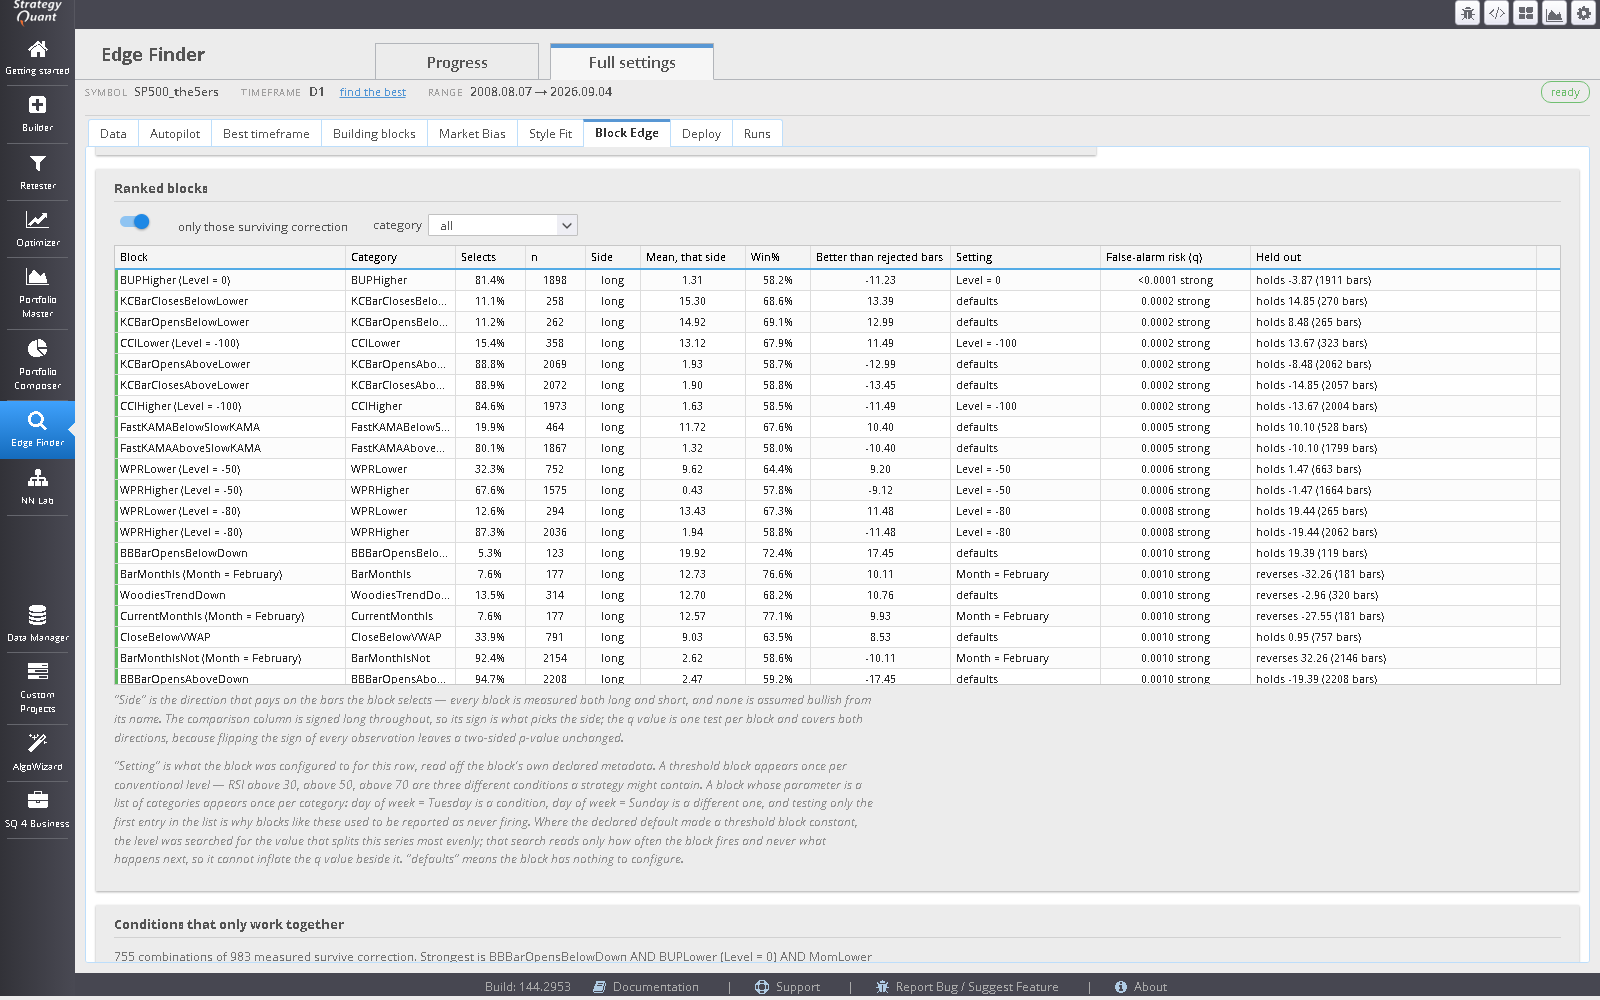
Continuation versus reversion by holding period, then seven curated block sets (161 distinct blocks) tested once each with false-discovery control. Each style is reported as its survivor count and an enrichment ratio, which is descriptive and not a p-value.
Each building block is measured as a conditional filter over the same engine, with multiplicity controlled, so you can switch off noise before the builder samples it.
Every figure is the same computation over a different subset of bars: take the next bar open to close, in account currency, grouped by side, regime, prior bar, calendar or block signal. Signals are read at bar t and the trade is taken at t+1, so there is no look-ahead.
Win rate and mean are both reported, with an explicit flag where they disagree, because a market can close up more often than down and still lose money.
The holding period is a setting (default five bars). Entries one bar apart share most of their bars, so the count is deflated by how densely a cell’s entries overlap. A longer hold buys a larger effect and pays with a smaller effective sample, reported as nEff beside the true n.
The headline figure is the largest of several, and a maximum of noisy estimates is biased upward. Reported maxima are shrunk in closed form for the number of candidates, and false-discovery control decides which findings are admitted at all.
The in-sample and out-of-sample ranges are read from the task’s own Data tab, so the analysis uses the split the build will use.
Spread, commission and slippage are not modelled. The figure is the expectancy of the move itself; cost modelling belongs to the build that follows with a real broker model.
Entering at the next open and exiting after a fixed number of bars is a bias detector, not a profit forecast. It has no stop, no target and no sizing. A figure from this tool is not what a strategy will earn.
.cfx file (the whole Build task) or a .sqb file (building blocks only).Software output is not investment advice and says nothing about future results. Validate every strategy yourself before risking capital.