What GapSmith does, and why
A missing minute in M1 history is not a flat minute; it is a stretch with no price path at all. In a tick-precision simulation, a stop or limit order that sits inside such a hole fills at the next price that exists, not where it would have triggered. That can flatter or punish a strategy for a reason that has nothing to do with the market.
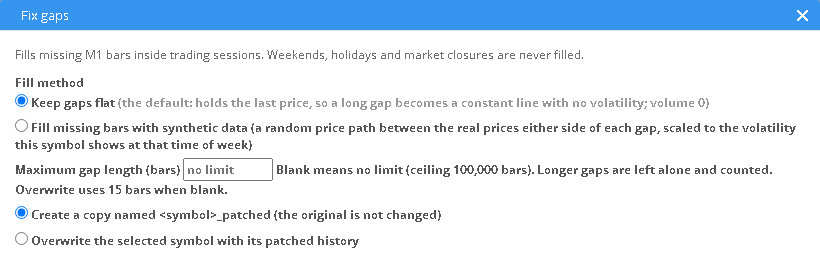
GapSmith fills genuine holes in M1 history. By default it keeps them flat: one flat, zero-volume bar at the previous close for each missing minute. If you choose, it instead writes marked synthetic bars into a separate <symbol>_synth symbol (or over the selected symbol if you choose to overwrite) (see Two ways to fill a gap). Weekends, holidays and anything that looks like a market closure are never filled. Any other gap is filled up to the maximum gap length you set; left blank, there is no limit, up to a safety ceiling of 100,000 bars (about 69 days of M1). The result is imported as a new symbol named <symbol>_patched by default, leaving your original data untouched. If you prefer, the dialog can overwrite the selected symbol with the flat-patched history instead. Every filled minute is written to an audit log. When you keep the copy, test your strategy on both.
Where it lives
There are two ways in. For many symbols at once, use the GapSmith tab: it lists every stored symbol, you tick the ones to check, and press Fix gaps in ticked symbols in the GapSmith ribbon tab. For one symbol you are already looking at, SQX’s own Analyze data quality dialog has a Fix gaps button in its footer, visible only while that tab is showing.
The ribbon tab has two buttons. Analyse ticked symbols only reads: it counts the missing bars and fillable gaps in each ticked symbol and fills the Missing, Fillable gaps and Result columns, so you can decide what to fix before anything is written. Clicking the GapSmith ribbon heading also opens the GapSmith tab below it.
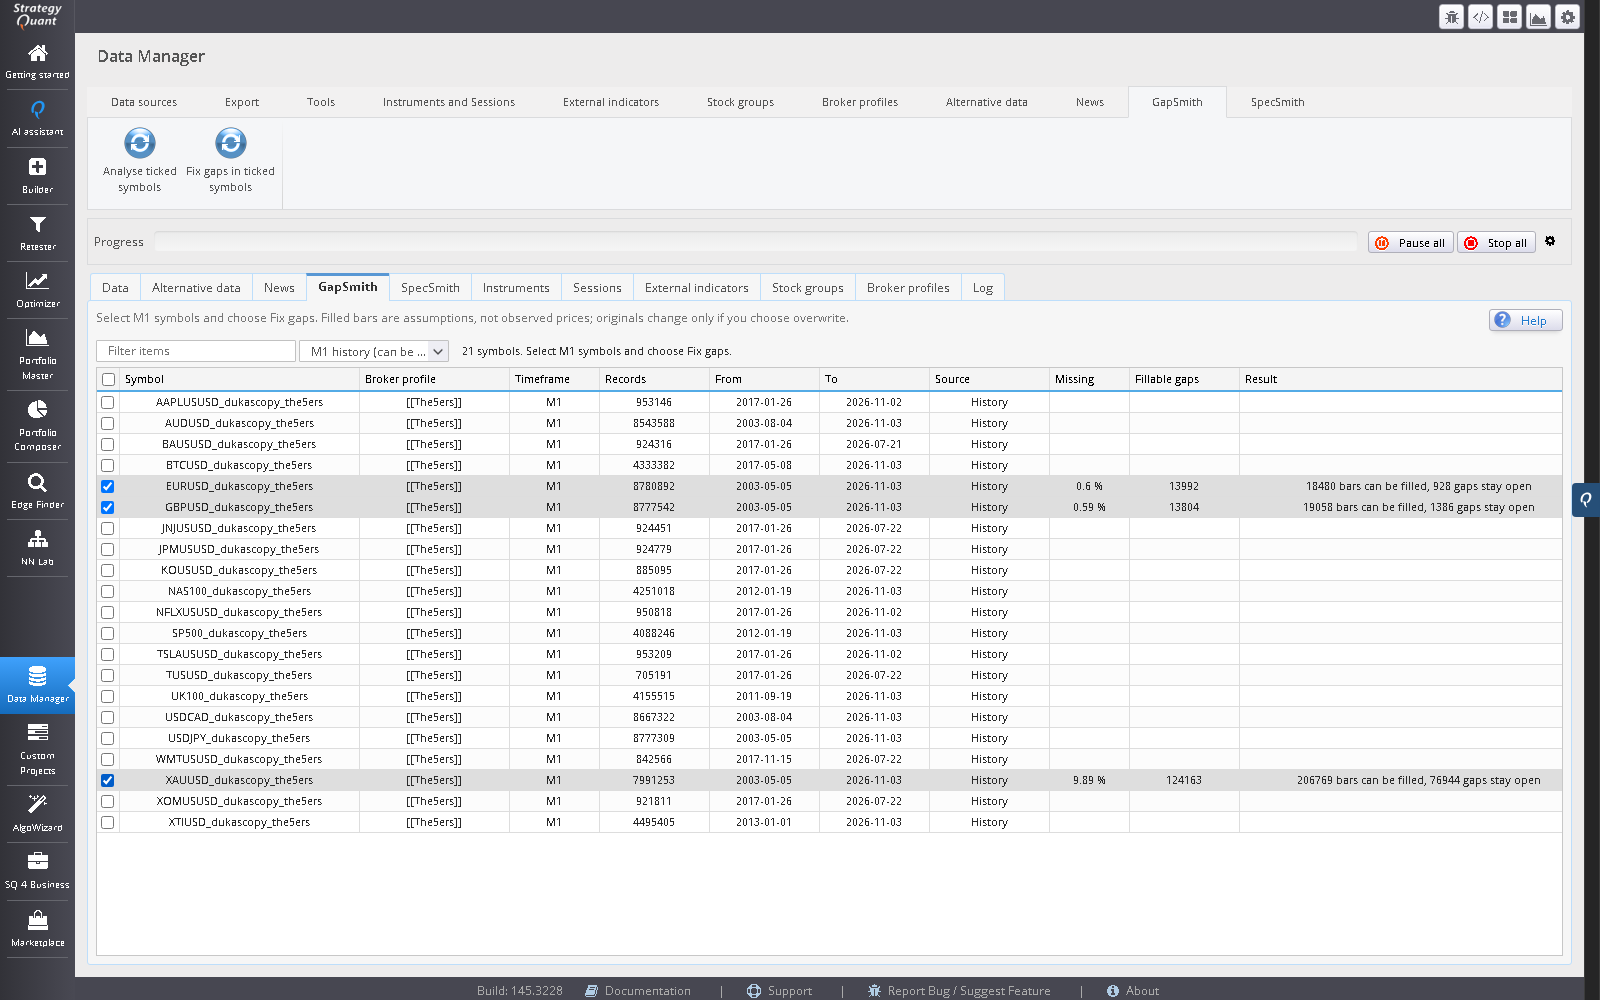
Data Manager → GapSmith → tick symbols → ribbon: Fix gaps in ticked symbols
Data Manager → Data → select a symbol → Tools → View & Analyze → Analyze data quality → Fix gaps
A run, step by step
Select M1 symbols
On the GapSmith tab tick the symbols (the grid shows M1 history by default, the only kind that can be patched), or on the Data tab select one and open Analyze data quality.
Open Analyze data quality
SQX shows its own gap analysis. The Fix gaps button appears in the dialog footer.
Press Fix gaps
GapSmith opens its dialog and checks every selected symbol. The table shows, for each: Bars, Missing (the share of the history that is empty), Fillable gaps, Left as is, and a Result line saying how many bars can be filled, or why nothing can be.
Choose how to fill
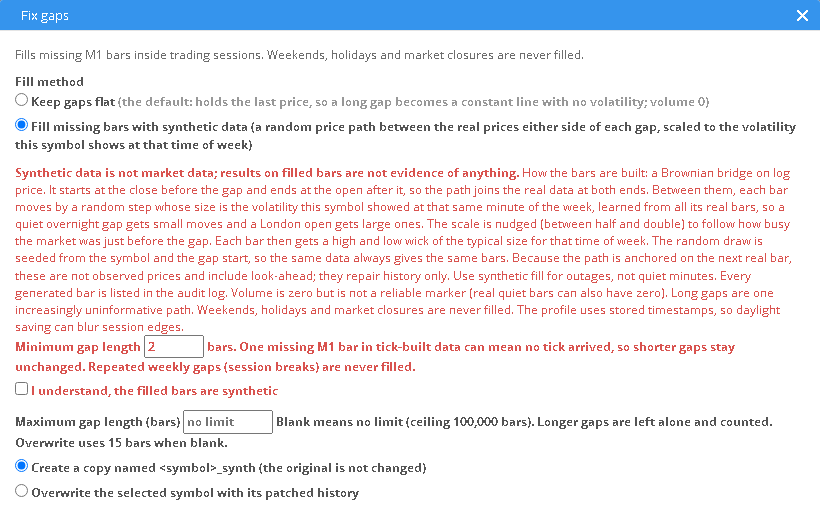
Under Fill method, Keep gaps flat is selected by default. Fill missing bars with synthetic data (a random price path between the real prices either side of each gap, scaled to the volatility this symbol shows at that time of week) shows a warning, asks for a Minimum gap length and for you to tick I understand, the filled bars are synthetic, and writes only a copy. Read Two ways to fill a gap before you use it.
Set the gap lengths
Maximum gap length (bars) is blank by default, which means no limit (up to the 100,000-bar ceiling); 0 means the same. Enter a whole number to fill only gaps up to that length. The field accepts whole numbers from 0 to 100,000; anything else disables the Fix gaps button and shows a message. Minimum gap length, shown for the synthetic fill only, is 2 by default: a single missing minute in tick-built data usually means no tick arrived, so shorter gaps stay as they are.
Choose copy or overwrite
The flat fill offers both: import the result as another symbol, or replace the selected one. Create a copy named <symbol>_patched (or
_synth) is selected by default; the original is not changed. Overwrite the selected symbol with its patched history replaces the symbol’s own history; it stays disabled until you tick I understand, overwrite the original. To go back to the original data, wipe the symbol’s data in the Data Manager (the symbol itself stays) and import the original file again. Overwrite works with both fills, and it is never unlimited: with the maximum gap length blank it uses 15, and you can type a larger number up to 100,000 (0 is refused).Check the counts, then press Fix gaps again
Each symbol with something fillable is processed in turn. Nothing is written until you press the dialog’s button.
Find the result
When the row reads Done and the dialog reports Finished, the new
<symbol>_patched(or_synth) symbol (or, after an overwrite, the selected symbol with its new bar count) is on the Data tab. If it is not visible yet, switch tabs and back.
Two ways to fill a gap
GapSmith 1.3.1 adds a choice to the Fix gaps dialog. The default, Keep gaps flat, fills the way GapSmith 1.0 did, so the fill itself does not change unless you ask for it. What 1.1 changes for both methods is the length limit: the fixed 15-bar cap is gone and the maximum gap length is yours to set (see above).
| Choice | What it writes | Result symbol |
|---|---|---|
| Keep gaps flat (default; the dialog says it holds the last price, so a long gap becomes a constant line with no volatility) | A flat bar for each missing minute: open = high = low = close = the previous close, volume 0. | <symbol>_patched |
| Fill missing bars with synthetic data (a random price path between the real prices either side of each gap, scaled to the volatility this symbol shows at that time of week) | A random path across the gap (a Brownian bridge on log price) that starts at the last real close and ends at the next real open. Each step is as large as this symbol's own volatility at that minute of the week, nudged up or down to follow how busy the market was just before the gap, and each bar gets a typical wick. The same data always gives the same bars. Volume 0. Every synthetic bar is listed in the audit log. | A new <symbol>_synth, or the selected symbol if you choose overwrite |
Why flat stays the default
History built from ticks has no bar in a minute in which no tick arrived. A missing minute can therefore mean that nothing traded, not that data was lost. For that case a flat bar at the last price is the faithful record, and any path drawn through it would be fiction. That reasoning is why GapSmith 1.0 fills flat, and it still applies to quiet markets and thin hours.
What the synthetic fill is
For a genuine outage, where the market was trading and your data source dropped minutes, a flat line is also not what happened. The synthetic option draws a path instead. What it is, exactly:
- A seeded Brownian bridge. A random walk on log price that starts at the previous close and is forced to end at the open of the next real bar. The size of its moves and of its wicks is learned from the symbol’s own history for each minute of the week, and scaled by how volatile the bars just before the gap were, so the filled bars have ranges and wicks, and busy hours differ from quiet ones. The random draw is seeded from the symbol name and the first missing minute, so the same data gives the same fill each time.
- One random draw, not what happened. It is one of many paths that fit the two end points. Another seed would give a different one. The real prices are not recoverable, and the fill does not recover them. The longer the stretch, the less its shape means.
- It uses the next bar. The path is built knowing where the market reopened, which nothing running live could know. That is acceptable for repairing stored history and is the reason the option is for history repair only.
- What it leaves alone. Weekends, holidays, market closures and gaps that start at the same time of the week again and again (session breaks); gaps shorter than the Minimum gap length (default 2) and gaps longer than the Maximum gap length (blank or 0: no limit, up to 100,000 bars). Volume stays 0 on every synthetic bar. The learned time-of-week profile uses the timestamps as stored, so for a symbol in a timezone with daylight saving it is blurred around the session open and close.
- Marked three ways. By default the result is a separate symbol with the
_synthsuffix; if you choose Overwrite the selected symbol, the synthetic bars go into the original symbol instead, and the sidecar log still lists every one. A sidecar log,<symbol>_synth.patchlog.csv, lists every synthetic bar with its gap, method, seed and prices. Volume is 0 on every synthetic bar, but volume 0 alone proves nothing, because real quiet bars can have it too. The CSV has the same six columns as any import file; it has no extra flag column, so rely on the symbol name and the log.
Synthetic data is not market data; results on filled bars are not evidence of anything.
When to use it, and when not
- Use it for outages only. The case it is built for is a feed that dropped minutes while the market traded, where you want tick-precision simulation to run over a continuous path.
- Not for quiet minutes. A quiet minute in tick-derived history has no bar because nothing happened. Filling it with a random path adds moves that never occurred and changes volatility. GapSmith cannot tell a quiet minute from an outage by itself; you have to know which your gaps are, for example from another data source for the same period. If you do not know, keep gaps flat.
- Never treat the filled minutes as evidence. Do not look at what a strategy does inside them. Run the same test on the original, the
_patchedsymbol and the_synthsymbol. If the result depends on which one you use, the fill is deciding it, and that is a finding about your data.
What we claim about its accuracy
Only what a test harness measured, and only on the data it was run on: three years of M1 bid prices exported from StrategyQuant X for EURUSD, USDJPY, AUDUSD and NAS100, from one source, with one random seed. The harness takes real runs of bars from dense stretches away from closures, hides them, trains the model without them, fills the hole with each method and compares the fill with the bars that were there. It scored the distribution of returns, volatility (ATR), autocorrelation of returns and of absolute returns, and the error of the close. Flat and a straight line between the two real prices were scored the same way as baselines. Hole lengths were 1, 2, 5, 10 and 15 bars on all four symbols, and 30, 60, 120 and 240 bars on EURUSD and NAS100. Nothing here goes beyond 240 bars.
The figures below are for one bridge draw, which is what GapSmith writes, over hole lengths of 2 to 240 bars, from the harness tables (results-v2 for 2 to 15 bars on all four symbols, both warm-up settings; the long runs for 30 to 240 bars on EURUSD and NAS100).
- Range and spread. The bridge’s volatility (ATR) was 0.94 to 1.01 times that of the real bars, against 0 for flat and 0.03 to 0.39 for the straight line. The distance between its return distribution and the real one (Kolmogorov-Smirnov D) was 0.017 to 0.048. The straight line’s D rose from 0.048 to 0.059 at 2 bars to 0.37 to 0.39 at 240 bars; flat’s was 0.30 to 0.50.
- Autocorrelation. The straight line’s returns were strongly positively autocorrelated (0.32 to 0.75) where the real bars were near zero (−0.08 to +0.03); the bridge was between −0.05 and +0.04. For absolute returns (clustering of large moves) the real bars gave 0.22 to 0.46, the straight line 0.40 to 0.80 and the bridge 0.16 to 0.43, so the bridge sits a little below the real bars in places.
- Accuracy of the close: one draw is worse than a straight line. One bridge draw had 1.35 to 1.52 times the straight line’s absolute error in the close at every length of 2 bars or more (EURUSD, 10 bars: 1.35 against 0.90 basis points). If the only goal were the closest close, the straight line would beat one draw. GapSmith does not offer it, because it flattens volatility.
- Averaged over 16 draws the bridge’s error was 0.99 to 1.05 times the straight line’s (about equal at 240 bars: 4.79 against 4.82 basis points on EURUSD), and its probabilistic score (CRPS) was lower than the straight line’s at every length from 2 to 240 bars on every symbol tested. That compares an ensemble with a single path, which the harness itself flags as not like for like, and GapSmith writes one draw, so these figures describe the method rather than any one fill.
- One bar. A single missing bar is pinned between two real prices, so the bridge and the straight line are identical on returns and error; the bridge differs only in having realistic ranges and wicks (ATR 0.93 to 0.97 of real, straight line 0.50 to 0.54).
Limits of this evidence. The hidden bars were ordinary bars from dense periods, not real outages: the genuinely missing minutes in the test files are rare and probably quiet or odd moments, and the next open almost gives away the last close on an ordinary bar, so the errors above flatter both methods compared with a real outage. The tests show how well a fill resembles ordinary bars; they do not measure your gaps. Metals, crypto, other timeframes, other periods and other seeds were not tested. They do not say that the fill is closer to what happened or that it recovers the true prices, and they say nothing about trading results; whether a backtest changes with a filled path was not tested.
What is filled and what is left alone
| Situation | What GapSmith does |
|---|---|
| Any other gap, within the lengths you set | Filled, by the method you chose. Keep gaps flat: flat bars (open = high = low = close = the previous close) and zero volume. Synthetic fill: synthetic bars, zero volume, in a _synth symbol. |
| A gap longer than the maximum gap length, or longer than 100,000 bars | Left alone, counted in the result and listed in the log. A long outage is information, not a rounding error. With the field blank only the 100,000-bar ceiling applies, and because a fill never crosses a weekend, a holiday or a closure, on FX, index and stock symbols it never spans more than about one trading week; only crypto, or data with no closed week, can be filled across days. |
| A gap shorter than the minimum gap length (synthetic fill only) | Left as it is, with no bar written. The default minimum is 2. |
| A weekend or holiday | Left alone, whatever its length. A weekend is a time of the week in which bars appear in fewer than 5 percent of the weeks (learned from the data once it spans 8 weeks; before that a Saturday rule stands in). A holiday comes from a built-in rule calendar chosen by the symbol’s name: fixed dates (24, 25, 26 and 31 December, 1 and 2 January), Good Friday and Easter Monday for FX and metals, plus the US exchange holidays for US indices; a name it does not recognise gets all of them, and crypto none. The calendar errs towards skipping, so some genuine outages on those days are left unfilled; a closure that follows no rule is caught only if the data repeats it. |
| A scheduled closure or recurring slot | Left alone. A gap of at least five bars that starts at the same minute of the week in a meaningful share of the weeks the data spans is what a weekly or daily session break looks like, and is not a defect. |
| History imported at a coarser resolution | Left alone. If some months of an M1 symbol were imported at a coarser timeframe, filling inside them would manufacture bars that never existed. |
| A symbol stored at another timeframe | Skipped, with a note: “Stored as H1. Only M1 history can be patched.” |
| Nothing fillable | Reported as clean or “all gaps are too long or sit in coarse history”, and no copy is made. |
What is written
Each run is three steps, shown as it goes (the result row then reports, for a synthetic fill, how many bars were made and how many gaps were left as they are): 1. write the patched copy (this reads the history twice and can take a minute); 2. import it into SQX as a new symbol through SQX’s own import; 3. wait for the import to finish. The result is:
- With Create a copy: a new symbol
<symbol>_patchedin the Data Manager, and the original symbol is unchanged. With Overwrite: the selected symbol itself holds the patched history, and you should check its broker profile on the Data tab. - A patched CSV and an audit log of every filled minute, under
user\extend\GapSmith\patches\. The flat fill’s log,<symbol>_patched.patchlog.csv, has one row per gap (start, missing bars, the close it was filled with). A synthetic fill writes<symbol>_synth.patchlog.csvwith one row per synthetic bar: time, gap start, gap length, index in the gap, method, seed and the bar’s prices and volume. A gap longer than the safety ceiling gets a row saying it was left unfilled. The original data files are never changed. - The original symbol’s broker profile is copied to the new one. If it cannot be, the dialog says so and you can set it with Edit on the Data tab.
A patched copy is real-looking price data that was not traded. It makes tick-precision simulation continuous across short outages; it does not recover what the market did in them. Treat a result that appears only on the patched symbol, or only on the original, as a finding about your data, and check it on both.
The same rule inside other modules
Edge Finder and NN Lab check the symbol on their Data tab and, when gaps matter at your timeframe and simulation precision, show a Data quality banner with a Make a patched copy button. It fills flat only, and keeps the 15-bar limit of GapSmith 1.0 (the button reads, for example, “fill N bars in M short gaps (≤15 min)”), with closures and coarse history left alone, and writes the same kind of audit log. The synthetic option and the adjustable gap length are in GapSmith only. GapSmith adds the same capability to the Data Manager for any symbol, without needing those modules.
Limits
- M1 history only.
- It does not recover what the market did during an outage; it bridges the gap so the path is continuous. A flat fill over a long gap is a constant line with no volatility: an assumption, not a neutral choice. A synthetic fill is one random draw, uses the next bar, and is for history repair only; the longer the stretch, the less its shape means.
- The synthetic option is not for quiet minutes, only for genuine outages, and its accuracy is claimed only as far as the test harness measured it: gaps of 2 to 240 bars, on the data it was run on. Longer fills are not backed by any measurement.
- It does not repair bad bars. Duplicate, backwards or invalid-OHLC bars are counted by the data-quality analysis, not changed.
- One symbol at a time is processed; several selected symbols are queued.
Troubleshooting
| Message or symptom | Cause and fix |
|---|---|
| No Fix gaps button | It shows only on the Analyze data quality tab of the “View data for <symbol>” dialog. Restart SQX if the plugin has just been installed. |
| “The GapSmith plugin is not running” | Restart SQX. If it persists, check that a licence key is activated (any key covers GapSmith) and the SQX log. |
| “You have to select some symbol” | Select at least one symbol on the Data tab before opening Analyze data quality. |
| “Only M1 history can be patched” | The symbol is stored at another timeframe. Select the M1 version. |
| “StrategyQuant refused the import” | SQX’s own import rejected the file; the message includes its reason. The patched CSV is still in the patches folder. |
| “A fix is already running on this symbol” | A fix holds its symbol from the moment you press Fix gaps (symbols queued behind another are held too) until the import has landed, whether or not the dialog is still open. Scanning or fixing the same symbol again is refused, and reopening the dialog shows the fix and its step. While SQX’s grid is running on this machine the fix is also listed in the Grid engine overview under the group AlphasWorth. Stopping it there ends the page’s wait and releases the symbol; a file already being written, or an import SQX has already started, is not interrupted. A fix nobody has touched for 20 minutes is released. |
| “The import has not finished after 15 minutes” | Check the Data Manager for the new symbol; a very long history can take time. |
| “The maximum gap length must be a whole number of bars from 0 to 100,000” | Type a whole number, or leave the field blank for no limit. With Overwrite, 0 or blank is not allowed as an unlimited length: blank means 15, and you can enter up to 100,000. |
| Fix gaps stays disabled with the synthetic fill | Tick I understand, the filled bars are synthetic, tick the overwrite confirmation too if you chose Overwrite the selected symbol, and give a minimum gap length between 1 and 1,000. |
A class such as AWDataPatch or NNBlockFeatureService is reported missing | You ran Compile all in the Code Editor while SQX was open. Restart SQX; after a Compile all, restart before you use GapSmith or NN Lab. |
| “Its broker profile could not be copied” | Set the profile with Edit on the Data tab for the new symbol. |