What Edge Finder is for
A StrategyQuant X build spends hours sampling combinations. Most of that time is spent on questions that could have been answered first: does this market lean long or short, which trading style’s building blocks fit it best, and which blocks carry any tendency at all? Edge Finder answers those questions by measurement, before the build, and then writes the answers into the Build task so nothing is retyped.
It is built on conditional expectancy. For each condition it asks what happened over the next few bars on the bars where the condition was true, compared with the bars where it was not. There are no backtests and no genetic search, so the same data and settings always produce the same table.
Edge Finder is a bias detector, not a profit forecast. Market Bias shows cost and net columns, Time Windows a Net per trade column, and Block Edge a cost line. They are applied only if the Data tab holds spread, slippage, commission and swap. Stops, targets and sizing belong to the build that follows. A finding says where to look, not what you will earn.
Where it lives and how it is laid out
Edge Finder is a tab in SQX’s left navigation. It uses SQX’s own layout, so it follows whichever skin (light or dark) you use. A header strip shows the symbol, timeframe and range; a progress panel shows the run state; and the tabs are:
- Autopilot
- One click starts a measurement run on the data you have set.
- Data
- SQX’s own Data tab: symbol, timeframe, date range, and Data range parts for the reserved bars.
- Best timeframe
- Ranks the timeframes you tick by how many modules find an edge on each.
- Market Bias
- Long, short or both; symmetry; drill-downs by regime, prior bar and calendar. Also holds the regime definition.
- Time Windows
- When in the day and week the market leans one way: the best entry windows, named sessions and stretches to stay out of, on a data clock that is checked.
- Seasonality
- Whether the return of a trading date depends on the calendar: day of week, day of month, week of month, week of year and month of year, tested together against surrogate series built from the same dates.
- Style Fit
- Seven trading styles ranked by how much of the instrument’s edge their building blocks concentrate.
- Block Edge
- Every SQX condition block and indicator scored as an entry filter.
- Deploy
- Writes the findings into a Build task, or saves them as a config file.
- Runs
- Everything run this session, with View and Cancel.
Analyses run one at a time on a background thread, so they never compete with your builds for CPU.
A first run, step by step
Set the data
On the Data tab pick a symbol, a timeframe and a range. Prefer five or more years of a liquid symbol. If the history has holes, a Data quality banner says so (see below).
Reserve some bars
Under Data range parts add an out-of-sample range. This is the same control a Build task uses, so what you reserve here is reserved there too. Without it, nothing is checked against data it did not help choose.
Run Autopilot
Press Autopilot and choose Current timeframe (or Everything to find the best timeframe first). It runs the measurement steps in a row and stops when they finish.
Read the three results
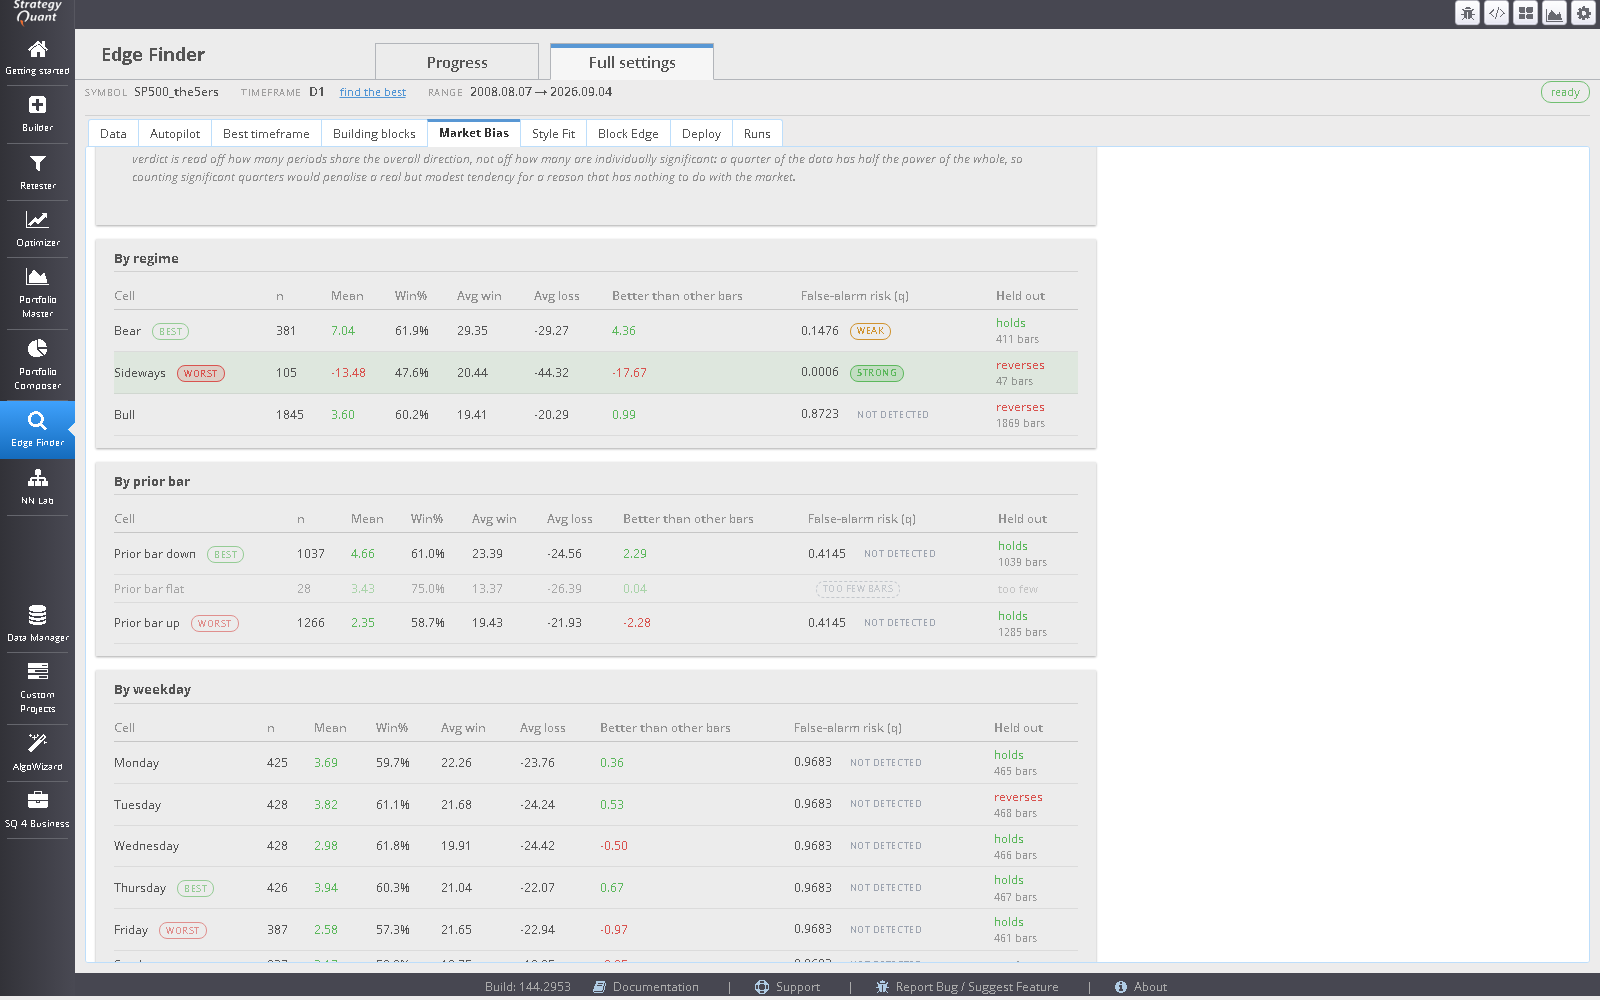
Check the grades in the False-alarm risk (q) columns and the Held out column before the means. A tendency that reverses on the reserved bars is the one to distrust.
Deploy
Open Deploy, choose a Build task, and press Apply. The measured side, symmetry, style and surviving blocks are written; everything else in the task is left alone, apart from the style’s entries and exits, which replace the task’s.
The Data tab, reserved bars and data quality
Reserved bars
Bars in a range you mark as out-of-sample are excluded from every measurement and used only for a direction check. The Market Bias header shows how many bars are in sample, how many are reserved, how many were excluded, and how many were dropped at the boundary. The boundary drop exists because a holding period of N bars reaches N bars past the signal; a sample close to the boundary would otherwise peek into the reserved range.
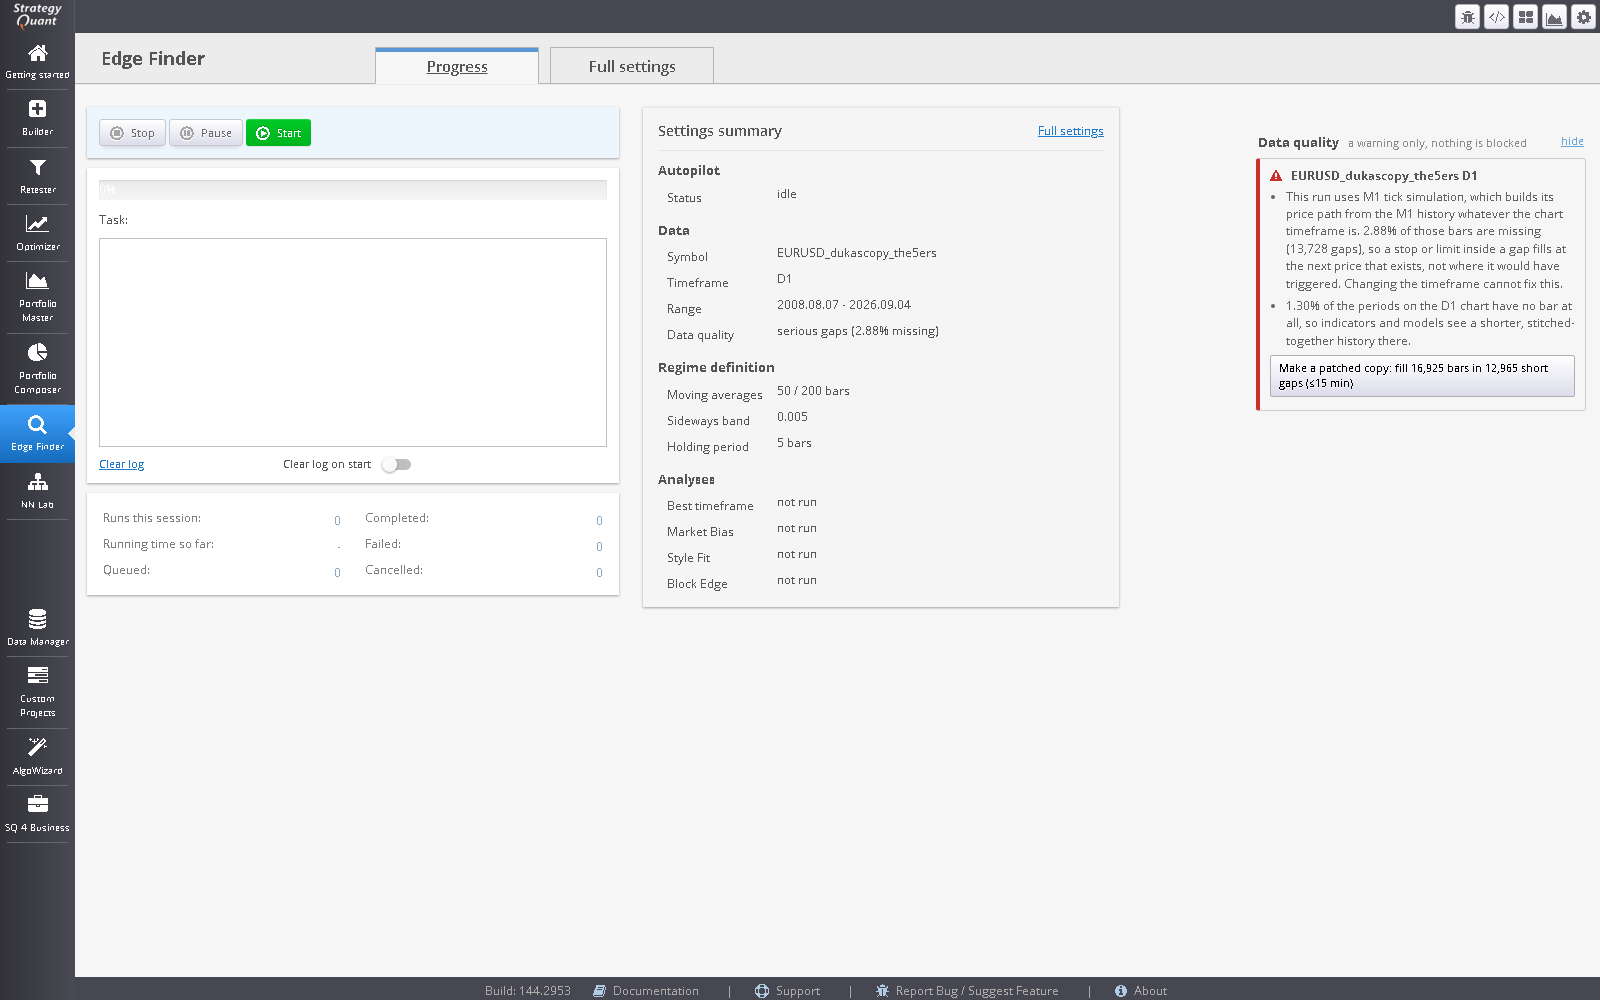
Data quality banner
Every time you open the module or change the setup, Edge Finder checks the symbol on the Data tab. It never blocks a run. If the history has gaps that matter at your timeframe and simulation precision, a banner says how much is empty and offers up to three actions: switch to a cleaner timeframe, use the cleanest date range, or Make a patched copy. The patched copy fills short holes (up to 15 bars) with flat, zero-volume bars at the previous close and imports the result as <symbol>_patched. The original is never changed, longer outages and scheduled closures are left alone, and every filled minute is written to an audit log. It is the same fill rule as GapSmith.
Regime definition and the holding period
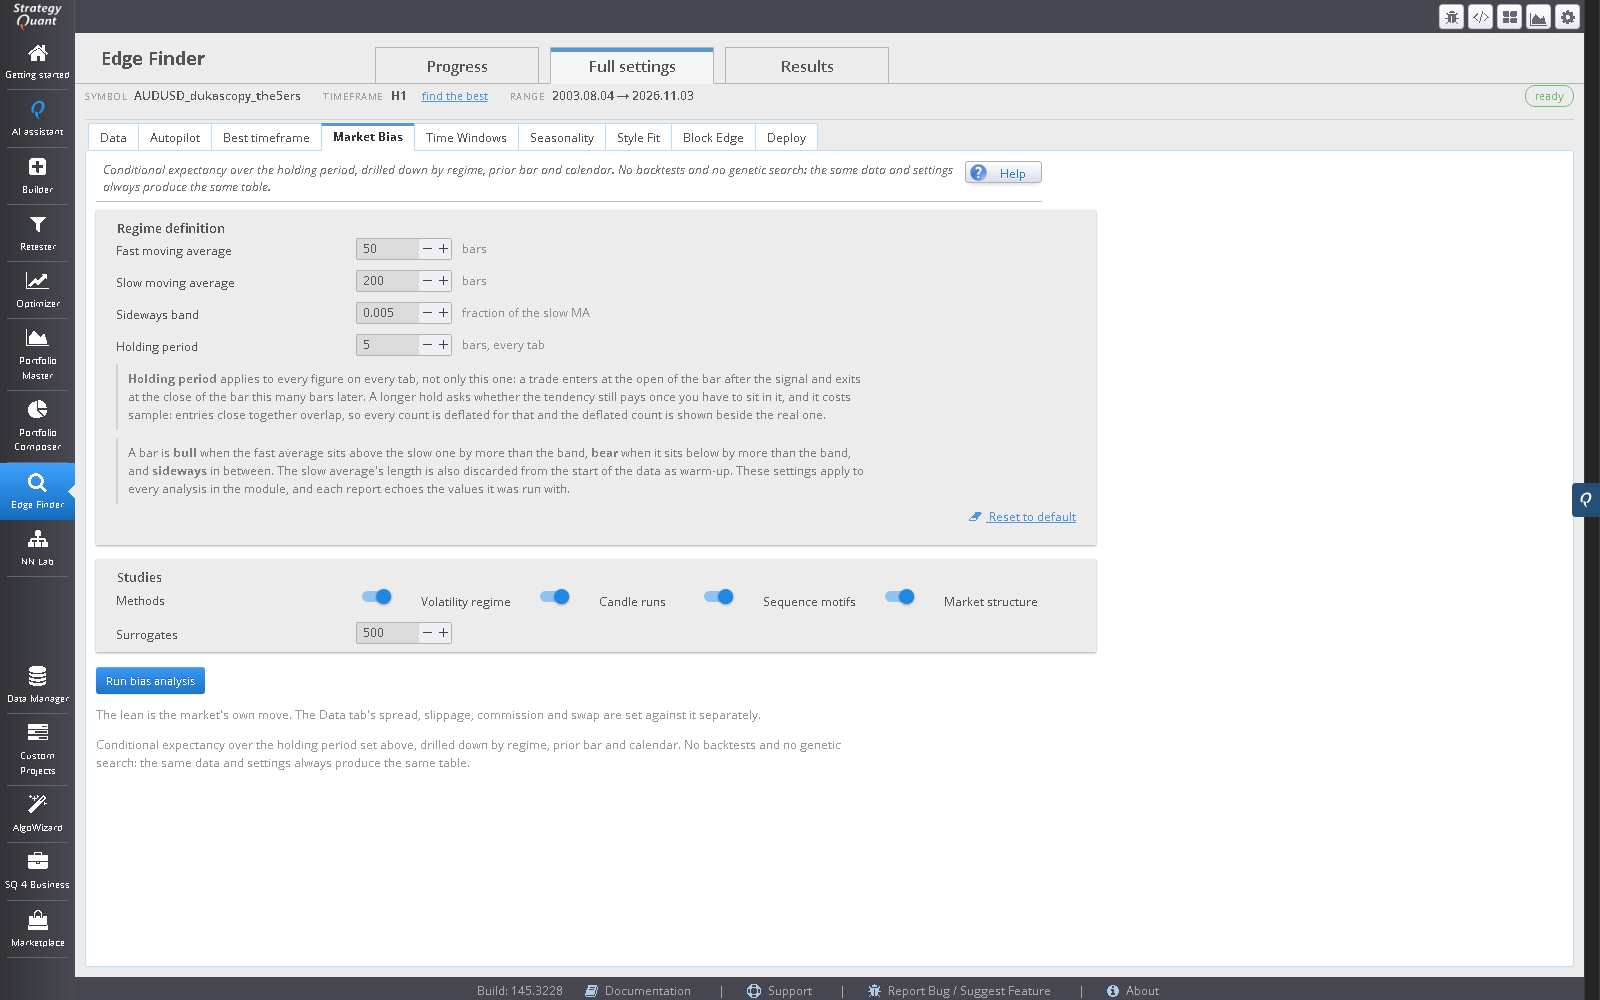
These four settings live at the top of the Market Bias tab and apply to every analysis in the module. Each report echoes the values it was run with.
| Setting | Default | What it does |
|---|---|---|
| Fast moving average | 50 bars | The faster of the two averages that define the regime. |
| Slow moving average | 200 bars | The slower average. A bar is bull when the fast average is above it by more than the band, bear when below by more than the band, and sideways in between. Its length is also the warm-up: that many bars are discarded from the front of the series, so raising it costs sample as well as changing the classification. |
| Sideways band | 0.005 (0.5% of the slow average) | Without a band, “sideways” would almost never happen, because two averages are exactly equal on approximately no bars, and the regime split would be dominated by meaningless flips around the crossover. |
| Holding period | 5 bars (1 to 500) | A trade enters at the open of the bar after the signal and exits at the close of the bar this many bars later. This is the most consequential setting in the module. |
Why the holding period matters
A condition that marks the start of a three-day move scores close to nothing on the bar it fires on. Measured over one bar, the same tendency would also look different on M5 and on H1 purely because a bar is a different length of time. A longer holding period asks the harder, more useful question: does the tendency still pay once you have to sit in it.
A longer hold is not free, and the cost is charged rather than hidden. Entries one bar apart share all but one of their bars, so their results move together and their count overstates how much independent evidence there is. Every test therefore divides each cell’s count by how densely its entries sit inside their own span, and shows the deflated count beside the real one wherever a p-value is shown. A longer hold buys a bigger effect and pays for it with a smaller effective sample.
The hold curve on the Market Bias tab is the way to choose the number: it prints the average move at a range of holding periods and marks where this instrument’s tendency peaks. Reading the peak off the curve and then setting the box to it is a selection, so treat what follows as a description of the past rather than a fresh finding. The curve is there to stop you holding for five bars on an instrument whose edge is gone after two.
How to read the tables
All three analyses share one vocabulary. Learn it once.
- Cell, n
- A subset of bars (for example “Tuesday” or “bull regime after an up bar”) and how many bars it holds.
- Mean
- Average result of holding for the holding period, entered on the bars in this cell. This is the gross move, before the Data tab's costs; the cost and net columns sit beside it.
- Win%, Avg win, Avg loss
- How often the hold closed up, and the average size of winners and losers.
- Better than other bars
- This cell’s mean minus the mean of every bar not in it. This, not the mean itself, is what a filter selecting these bars would buy you, and it is the comparison the significance test runs on, because a cell and the market average are not independent samples: the average contains the cell.
- False-alarm risk (q)
- The chance this row is noise. A table tests many cells at once (24 hours, 12 months), so testing each at 5% would turn up something “significant” on almost any data. q is the p-value adjusted for how many cells were tested (Benjamini–Hochberg): at q < 0.10, roughly one in ten of the rows accepted is expected to be noise. Lower is stronger.
- Held out
- Whether the cell points the same way on the reserved bars: holds or reverses. It checks direction, not significance. A reserved window is a fraction of the history, so a real but modest tendency will often fail a test there. A cell that reverses is the one worth distrusting. too few means the reserved bars had too little to say.
- best / worst
- Highest and lowest mean in the table among cells with enough bars. A filled chip means the cell also survives correction; an outlined chip means it is only the extreme of numbers that cannot be told apart.
The grade beside each q
| Grade | Meaning |
|---|---|
| strong | q < 0.01. Accepted. |
| clear | q < 0.10. Accepted. Only strong and clear are counted as survivors anywhere in the module. |
| weak | q between 0.10 and 0.25: too weak to build on, too strong to call measured noise, and a reason to re-run over a longer range. |
| not detected | The row was measured and nothing was found. The only grade that supports saying there is no effect. |
| too few bars | The row was never tested; its q is an artefact of that and says nothing either way. |
Market Bias
Press Run bias analysis. The result is a set of sections:
- Hold curve
- Average move by hold length (entry at the next open, exit at the close of the bar shown). It has no p-values on purpose: at a horizon of N bars, consecutive observations overlap by N−1 bars, so a significance test over them would overstate its case badly. The significance claim stays with the run’s own holding period, where observations are independent.
- Entry / exit symmetry
- Paired states (for example bull versus bear regime) with the long side, the short side, the gap between them and its q. Long and short are measured as independent populations, so a strong side cannot hide a weak one. thin flags a pair with too little data.
- Summary figures
- Mean per bar, win rate, profit factor (gross win over gross loss), the significance against zero, and the sample after warm-up.
- Higher-timeframe context
- The same long-side figures on a higher timeframe, beside the traded one, so you can see whether the tendency lives only at one scale.
- Does it still hold?
- The sample is split into periods of equal numbers of bars (not equal calendar time, because data density varies with gaps and holidays) and each period reports whether it shares the overall direction. The verdict counts agreeing periods, not significant ones: a quarter of the data has half the power of the whole, so counting significant quarters would punish a real but modest tendency for a reason that has nothing to do with the market.
- Drill-downs
- Tables by regime, by regime × prior bar, and by calendar (hour of day, day of week, month), each with the columns described above.
Use the result to choose the market side (long only, short only, or both) and to decide whether entries and exits should be symmetric. Deploy applies that decision.
Studies
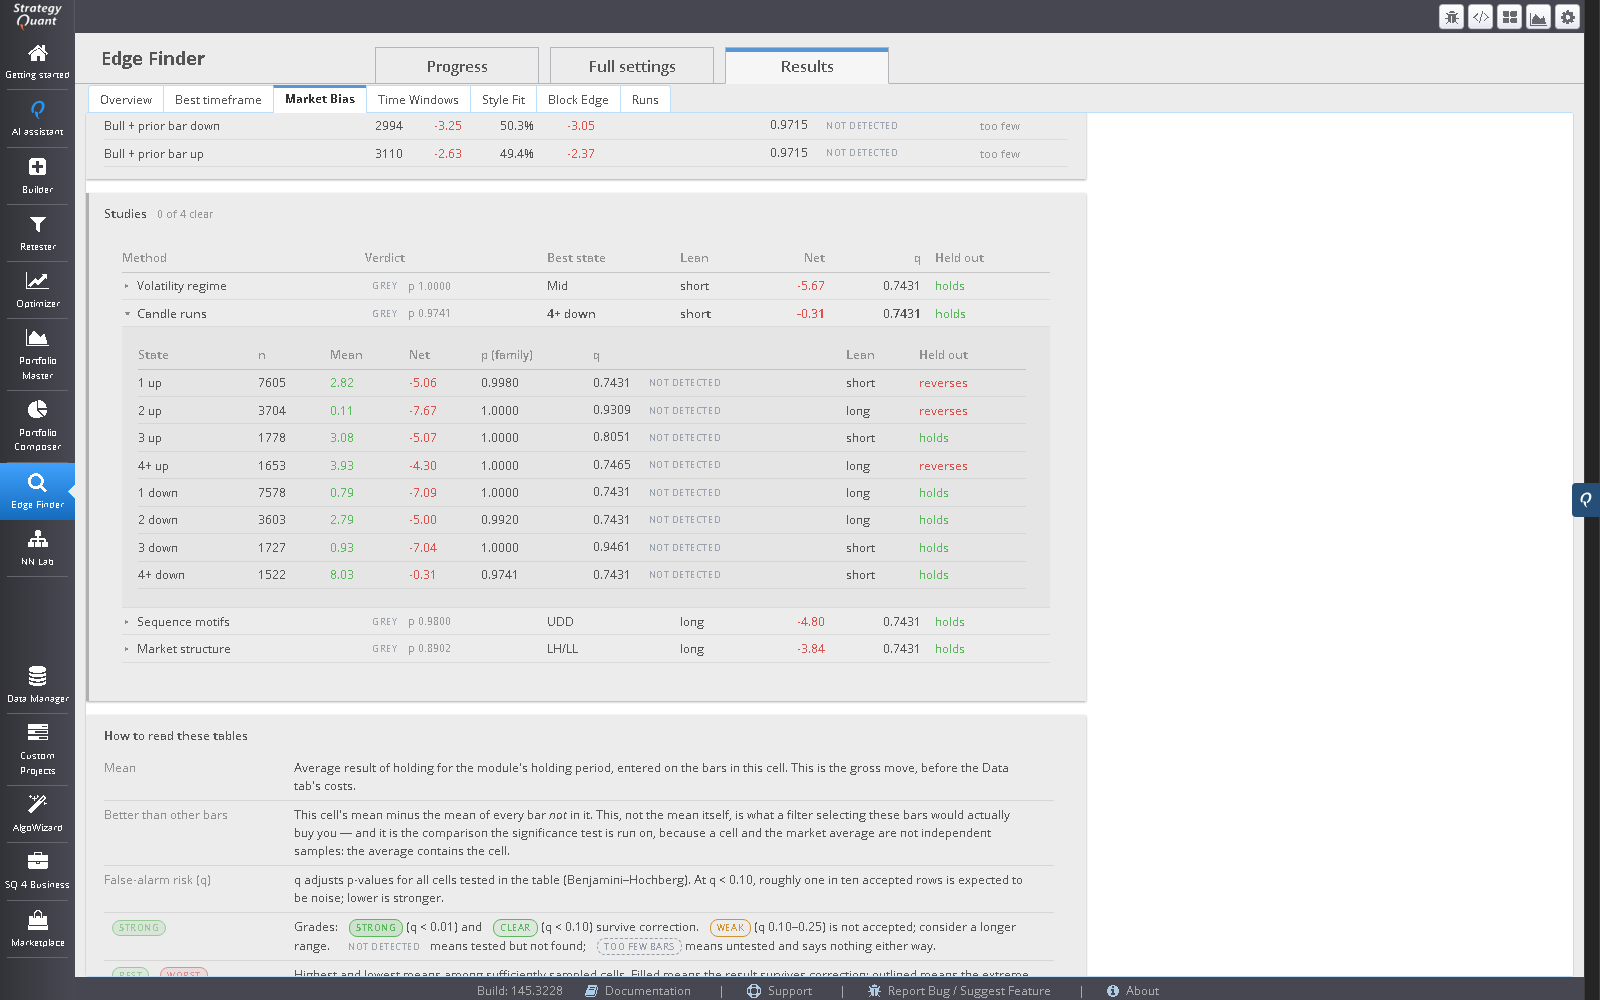
Four optional studies sit beside the Market Bias analysis. Tick the ones you want under Studies on the Market Bias settings tab. None is run by default, and with none ticked the result is exactly what it was without them. Each asks whether the move that follows a market state differs from the move that follows the other states, using the same trade as every other tab: enter at the next open and hold the module’s number of bars, with the same overlap deflation and the same reserved-bar and boundary rules.
- Volatility regime
- The true range’s percentile rank over the last 50 bars, the bar itself included and nothing later, in terciles of that rank: low, mid, high. The average absolute move that follows each group is listed for information and is not tested.
- Candle runs
- How many candles in a row have closed the same way: 1, 2, 3, or 4 and more, up and down. A candle that closes at its open ends the run and has no state.
- Sequence motifs
- The up/down pattern of the last three candles, eight patterns written oldest first (UUD is up, up, down). A flat candle among the three leaves the bar without a state.
- Market structure
- Swing highs and lows with three bars on each side. A swing is used only once its right-hand bars have closed, so no state looks ahead. The last two swing highs and the last two swing lows give higher highs and higher lows (HH/HL), lower highs and lower lows (LH/LL), or mixed.
The test. For each state the statistic is Welch’s t of that state against the bars of the other states, using the effective counts the rest of the module uses. Its null comes from surrogate series rather than a formula. Volatility regime and sequence motifs rotate the state sequence around the data in a circle, which keeps its run lengths and autocorrelation and breaks only its alignment with the returns. Candle runs flip the sign of each candle independently (a candle-sign flip; a flat candle stays flat). Market structure resamples the state sequence from a first-order Markov chain fitted to the observed transitions, stretch by stretch. The returns themselves are never altered. The number of surrogates is the Surrogates setting (default 500, at most 2000). Surrogates are seeded: the same data and settings always give the same answer.
The threshold. Every tested state of every ticked method forms one family. In each surrogate round the largest statistic over the whole family is recorded, and a state’s family-wise p is the share of rounds in which that largest value reached the state’s own. It is the charge Bonferroni or Sidak would make for the number of states, taken from the surrogates instead of a formula. A state survives below 0.05. Because more candidates can only raise the largest value, ticking another method never makes an existing state easier to pass, and p-values are never combined between methods. The smallest p a run can report is 1 / (surrogates + 1). A state is not tested, and does not count towards the family, when it or the rest of the bars holds fewer than 30 bars. The q beside each state is Benjamini-Hochberg over the per-state p of the family (the share of surrogates that matched that state on its own), graded as in the other tables.
Verdicts. Each method gets a colour from its best state.
- green
- A state survives the threshold, still pays after the Data tab’s costs on the side it leans to, and points the same way on the reserved bars.
- amber
- A state survives but fails the cost test or the held-out test. Without a reserved window there is nothing to hold it out against, so a method cannot be green and the card says no held-out window. If the Data tab’s costs cannot be converted for the instrument the net is unknown and the method stays amber.
- grey
- No state survives.
The top line reads k of m clear: green methods out of the methods ticked. Click a method to see its states: bars, gross mean and net for the lean side, p and q, and the held-out direction. As elsewhere, held-out is direction only, not a significance test.
What this is not. Studies do not feed the Overview headline, Best timeframe or Deploy. A state that survives here is a lead to test, not a strategy: it says the move after that state differed from the move after the others on this sample, not that it will keep doing so, and anything you try next is outside the family that was charged. Nothing here is investment advice.
Time Windows
Market Bias already breaks the tendency down by hour and by weekday, one dimension at a time. Time Windows answers the question a trader asks: between which hours, on which days, is it worth taking an entry at all, and which stretches should I stay out of? It runs on intraday bars (H4 or shorter) and uses the same trade as every other tab: enter at the next open, hold the module’s number of bars. The Data tab’s costs, if it holds any, are set against the move in a separate Net per trade column.
The data clock
SQX stores a dataset’s bar times in the timezone the dataset was recorded in, so every hour you see here is an hour on the data clock. That is also the clock SQX evaluates a Build task’s time range on, so a window found here and written back is self-consistent. It is not the same instant on another feed: a London open is 08:00 London time all year, but it moves against a New York close data clock for about three weeks each spring and autumn.
- Where the zone comes from. The dataset’s declared timezone (an IANA name such as
Europe/Berlin,UTC, a fixed offset, or SQX’s ownEETUS, the New York close server clock). If a dataset declares none, type one into Data clock. If the zone cannot be resolved, windows are shown on the data clock only and the session views are switched off. Nothing is silently assumed to be UTC. - The clock audit. Forex style markets reopen after the weekend at 17:00 New York. Each week’s first bar is converted to New York time under the declared zone; a correct label puts every week on the same minute. A feed that is recorded on a slightly different clock than it is labelled with lands one hour early or late in a few weeks only. Those weeks are counted, listed, and left out of the scan by default (there is a switch to include them). The audit covers currency pairs on H1 or shorter. It says it was skipped, and why, for indices, stocks and futures, which have no such anchor, and for longer timeframes.
What is searched
A window is a run of consecutive time-of-day slots on a 24-hour ring, so it can cross midnight. Slots are 60 minutes on H1 and above, 30 on M30 and 15 on M5/M15, or you can choose 5, 15, 30, 60, 120, 240 or 360 minutes. A slot is never shorter than a bar: a shorter choice is raised to the bar length, and the result says so. Windows up to the longest window setting (12 hours by default) are tried on twelve fixed weekday sets: all days, Mon-Fri, each single weekday, Mon-Thu, Tue-Thu, Mon-Wed, Wed-Fri and Tue-Fri. Arbitrary weekday subsets are deliberately not offered, because they mostly reward noise.
Short and long slots. Slots of 120, 240 and 360 minutes give 12, 6 and 4 slots a day, so a window is a few slots wide; the longest-window setting still caps it (at the default 12 hours a 360-minute window is one or two slots; four only if you raise the longest window to 24 hours). A 5-minute slot gives 288 slots a day and, at the default 12 hours, 497,664 windows. The correction covers every one of them, so a window has to clear a higher bar than the same hours would at 15 minutes. Measured on M5 bars on one machine, a run took about three times as long as at 15 minutes (5 seconds against 1.5 on 100,000 bars; 12 seconds against 4 on eleven years) and needed a larger memory allowance (on eleven years it finished with a 384 MB heap and ran out at 256 MB, where 15-minute slots still finished). The search is capped at 500,000 windows, so with 5-minute slots a longest window above 12 hours is cut back to 12 and the result says so. A 5-minute window also rests on fewer bars per date, so its numbers are noisier. Use it only when your entries really are timed to the minute; the coarser slots answer “which part of the day” with less noise.
Each date contributes one number to a window: the total entry result of the bars inside the window that day, with the average bar subtracted. Subtracting the average bar removes the instrument’s drift, so the question is “does this window lean differently from the average bar”, not “did the market go up”. One number per date also removes the overlap between neighbouring bars’ holding periods: the sample size is days, not bars.
The correction is sized for the search
Searching every window and reporting the best one is a search, and a q-value over a handful of cells does not describe it. The test here is a max-t sign-flip permutation over the whole family: under the null, flipping the sign of a whole date keeps its intraday shape and volatility and changes nothing else. Each permutation records the strongest window anywhere in the family, and a window’s adjusted p is the share of permutations whose strongest window reaches its own strength. It therefore pays for every window and weekday set that was tried, reported or not. The permutations are seeded, so the same data and settings give the same answer. The grade (strong below 0.01, clear below 0.10, weak below 0.25) is read from this adjusted p.
Reading the result
- Clock card
- The zone, where it came from, and the audit verdict.
- Hour by weekday
- A grid of colours: green leans long, red leans short, against the average bar. Outlined cells survive correction across the grid. Grey cells have too few days to be measured, which is not the same as no tendency.
- Best windows
- The strongest windows that are not the same window again. Edge per bar is the window’s average entry result minus the average bar’s, in the instrument’s own units. Activity is the window’s average bar range against the overall average. Even / odd weeks checks the edge points the same way in both halves of the sample. Reserved range re-measures the window on bars the search never saw, and a window whose sign is contradicted there is not recommended. Under each row the window is shown on UTC, New York and London for a winter and a summer date, because an offset that moves cannot be one number.
- Named sessions
- Sydney, Tokyo, London, New York and the London/New York overlap, each on its own exchange-local clock so daylight saving moves them for you. Corrected across these five only: they are a short fixed list, not a search.
- Net per trade
- The window’s own average entry on the side it leans, less the Data tab’s costs. Only windows where it is positive are listed for a one-sided search. If the Data tab names a trading session, entries outside it are not trades, and a window is trimmed to the session.
- Stretches to stay out of
- Windows that lean significantly against the side your build trades (set Side the build trades), plus dead stretches (less than 60% of the average bar range) and thin ones (less than half the average tick volume). The dead and thin lists are descriptive, not findings: the worst hours are often the costliest rather than the most adverse, and a stretch is not a window to trade in.
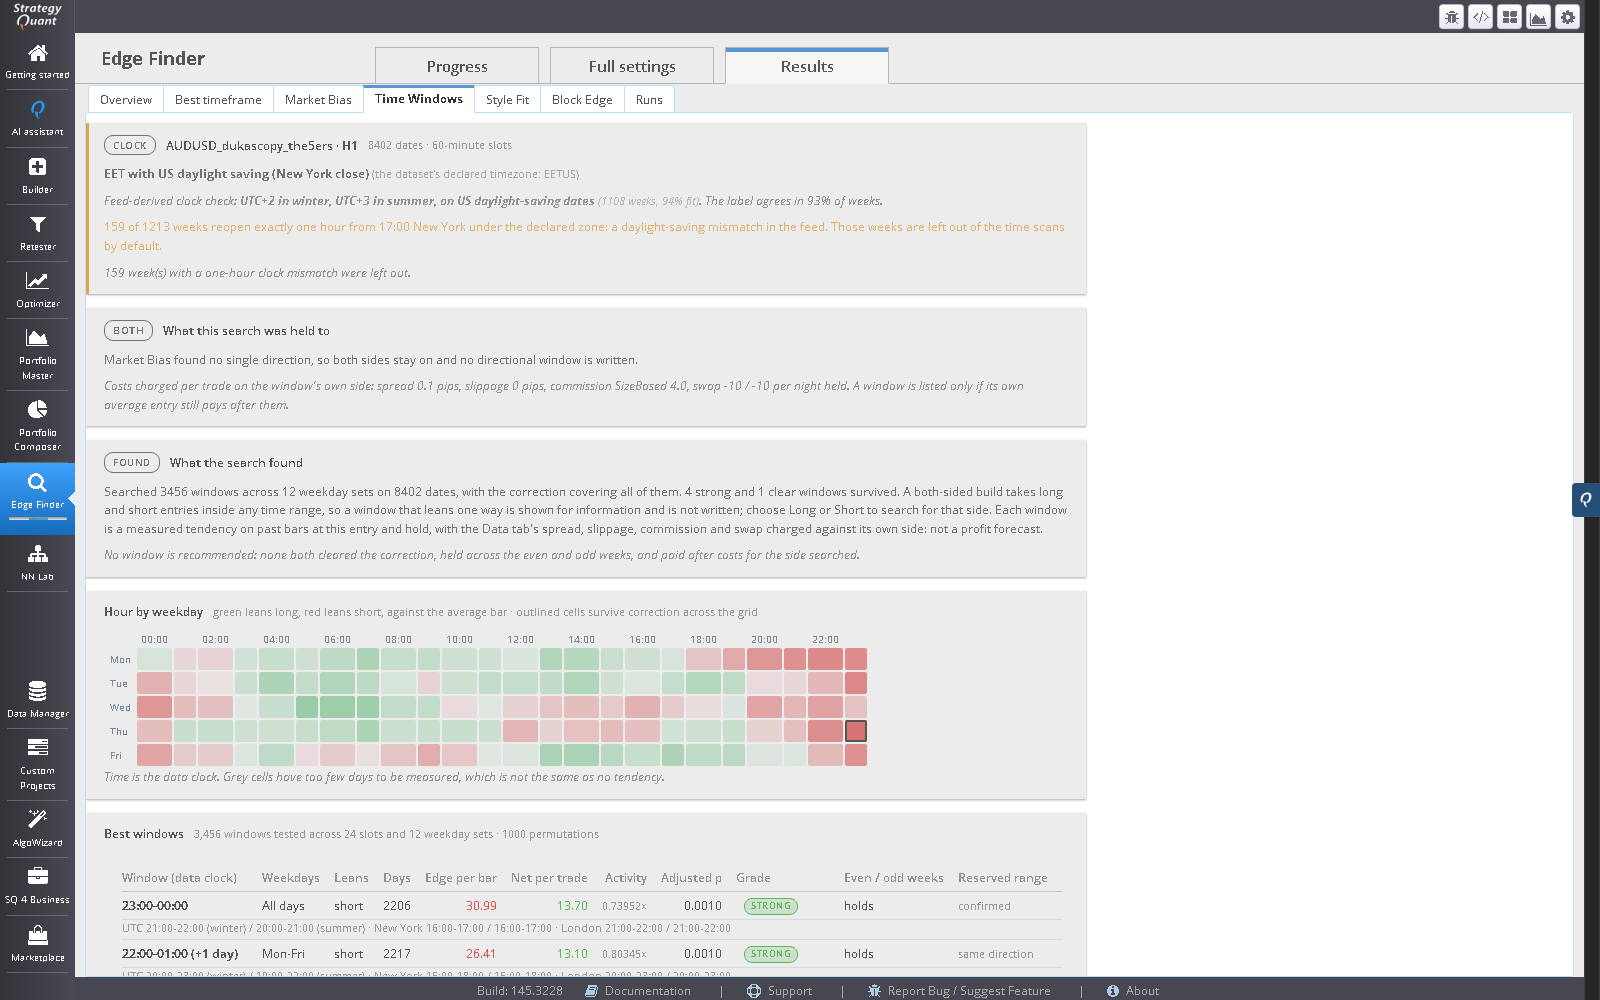
A window restricts when an entry may be taken. Because the trade is held for several bars, the strongest entry window often sits a few bars before the move it catches. That is the right answer to “when should I enter”, and it is why the window is not a description of when the market moves.
Writing a window to a Build task
On the Deploy tab, Time range writes the recommended window to the target task’s own Limit time range (switched on, from, to), in seconds after midnight on the data clock. A window that crosses midnight is written as an overnight range, which is how SQX’s own option reads a From later than its To, and a window that ends at 24:00 is stored with a To of 00:00, as the option’s editor does. The weekday set is not written: the task has no weekday filter beyond its weekend settings. Exits are not touched. If your trading broker’s clock differs from the data clock, check the converted times shown under the window before you trade it.
When Time Windows and Market Bias disagree
Market Bias decides the sides for the whole sample; a window leans long or short relative to the average bar. The Deploy tab compares them and says which case you are in:
- Agrees
- Both lean the same way. The time range narrows when those entries are taken.
- Market Bias is neutral
- It found no single direction and keeps both sides on. The window is a finding of its own: the lean is concentrated in those hours. A time range applies to both sides, so entries on the other side inside the window would lean against it. You can tick Follow the window to trade the window’s side only.
- Contradicts
- Market Bias chose one side and the window leans the other. A time range cannot turn a short-only build into a long one, so the window is not written by default and its checkbox is locked. You choose: keep Market Bias’s side and skip the window, or tick Follow the window, which overrides Market Bias and writes the window’s side as the market sides. The explanation also tells you when the average entry inside the window still points the other way and is only weaker there.
- Unknown
- No current Market Bias result for this market (or one measured on another symbol or timeframe). Run it to check.
The same rule is enforced when the deploy is written, whatever the screen sent: a time range is never written against the sides the same deploy writes. On the Time Windows tab, Side the build trades defaults to the side Market Bias chose when it has run, so the stretches-to-avoid list is judged against the side you will trade.
Limits
- Costs come from the Data tab. If it holds none, none are charged. A window is a measured tendency on past bars, not a profit forecast.
- Exchange holidays and early closes are not modelled.
- Daily and longer bars have no time of day and are refused.
- Sparse intraday data (feeds with many missing minutes) leaves slots with too few days; they are shown as unmeasured, not as flat.
Seasonality
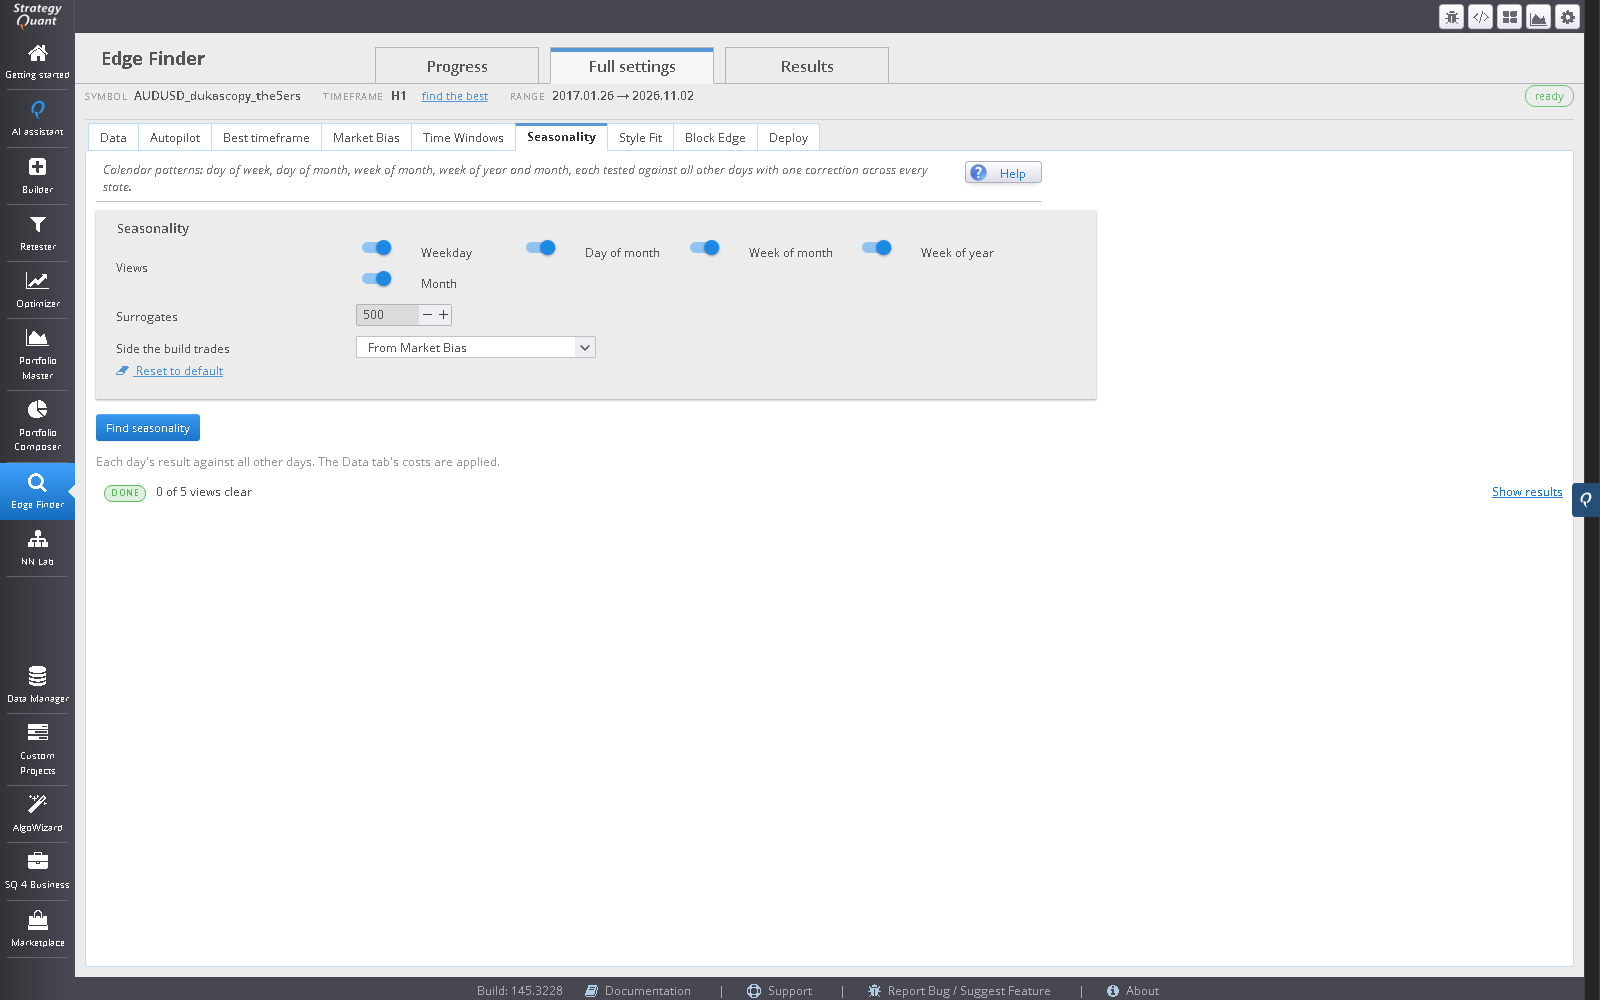
Time Windows asks which hours of the day carry a tendency. Seasonality asks the same question of the calendar: does the return of a trading date depend on where the date sits in the week, the month or the year? It works on daily bars and on intraday bars, and it reads the clock the same way Time Windows does, including the clock audit and the switch that leaves out weeks the audit flags. It is a separate tab: nothing in Market Bias, Time Windows, Style Fit, Best timeframe or Deploy reads it or changes because of it.
The five dimensions
- Day of week
- Monday to Friday. Saturday and Sunday appear only for a market that trades them (a crypto feed has seven). A short evening session on a Sunday, with fewer than a quarter of the bars of a normal date, is not a trading date of its own and is left out and counted.
- Day of month
- 1 to 31. The late days (29 to 31) have fewer dates and are the first to be reported as too thin.
- Week of month
- Defined as the day of the month divided by seven, rounded up: days 1–7 are week 1, 8–14 week 2, 15–21 week 3, 22–28 week 4 and 29–31 week 5. These are not calendar weeks; week 5 is a stub of two or three days.
- Week of year
- The ISO week, 1 to 53, with the ISO week-year, so the last days of December can belong to week 1 of the next year and the first days of January to week 52 or 53 of the last. Week 53 exists in only five or six years of every twenty-eight, so it is almost always reported as too thin, not folded into week 52.
- Month of year
- January to December.
You can tick any subset; all five are ticked by default, because the tab exists to look at all of them.
What one observation is, and what counts as n
One number per trading date: enter at the open of the first usable bar of the date and leave at the close of its last usable bar. For a daily bar that is the bar; for an intraday feed it is the whole date. The Data tab’s spread, slippage and commission are charged once per date, and the swap for the nights the trade is held. The date is the date on the data clock. A date that straddles the edge of a reserved range is left out, and so are the dates of weeks the clock audit flags unless you include them.
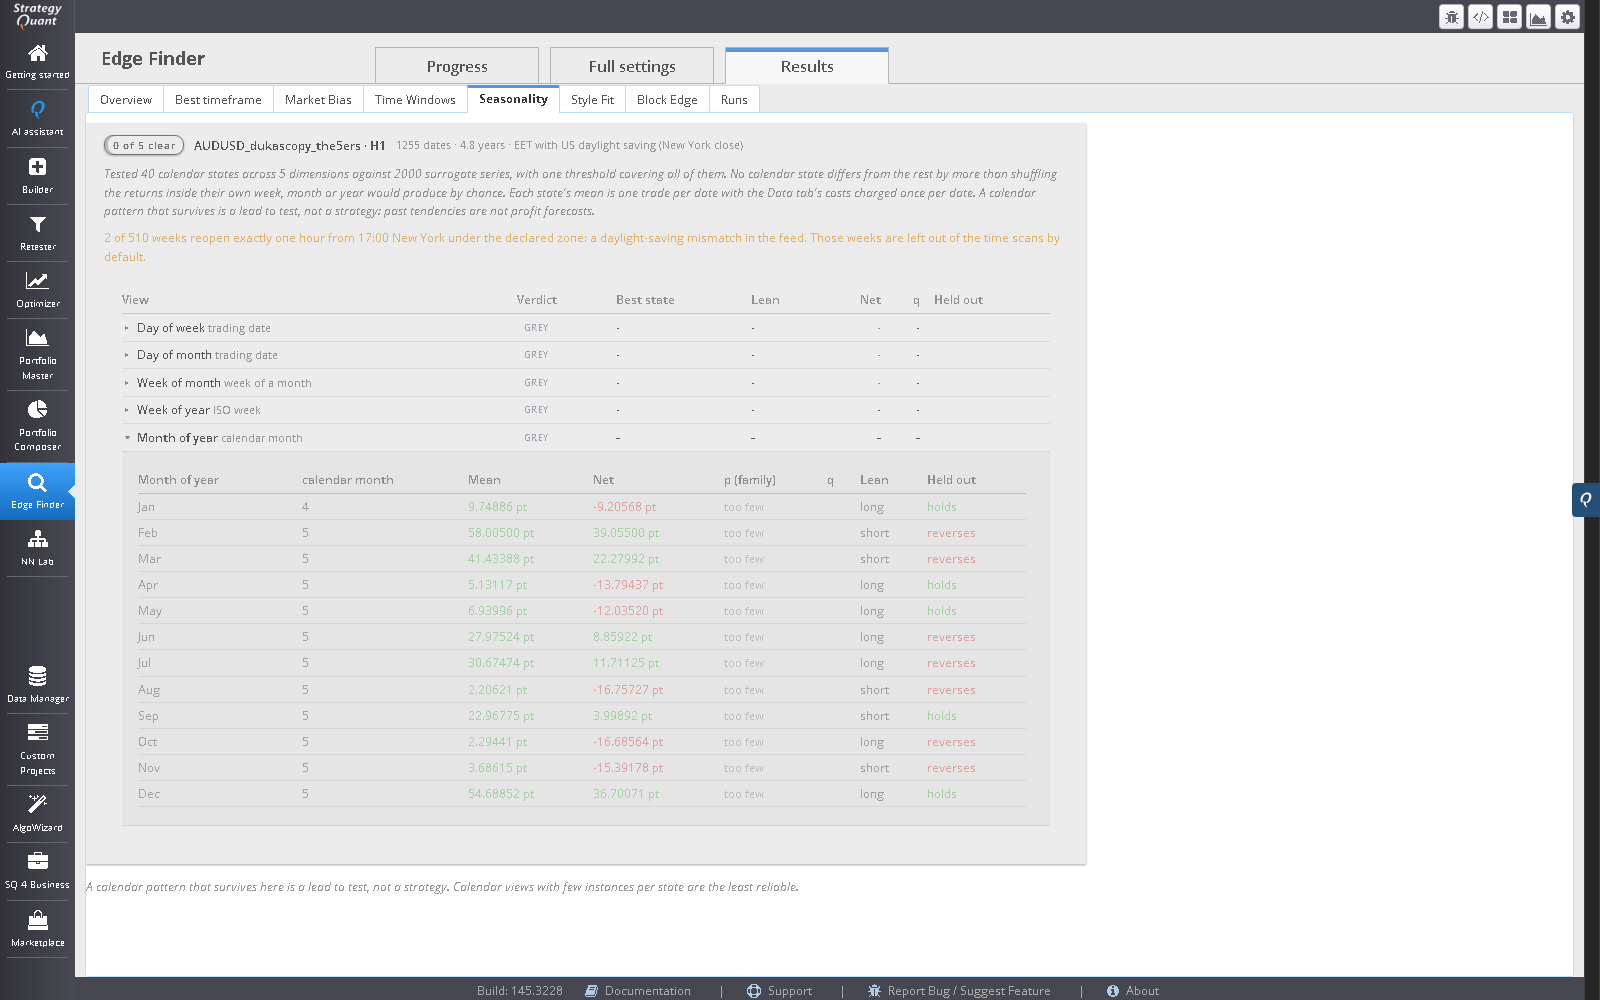
Dates inside the same calendar instance (March 2019, ISO week 12 of 2019, the third week of June 2018) share their volatility, their news and their trend, so they are not independent draws and counting them as such would overstate the evidence. For month of year, week of year and week of month the unit is therefore the instance mean: one number per instance, and a state’s n is the number of instances (for example the eleven Marches of eleven years). For day of week and day of month the unit is the date, and n is the number of dates. The result says which rule each dimension used.
A state with fewer than 10 instances (instance dimensions) or fewer than 30 dates (date dimensions) is reported as too few and is not tested, and it stays in the table. Month of year and week of year are not run at all on fewer than three years of dates; they are shown grey with the reason. Dimensions that are not run add nothing to the family below.
The test
The statistic of a state is a standardised difference between the mean of its units and the mean of all the other units (a Welch t, with the state’s variance drawn partly towards the others’ because a state of eleven instances has too few to estimate its own). Its null is built from the same dates. If the calendar does not matter, the returns of the dates inside one larger block of the calendar could have fallen on each other’s days, so each round shuffles the date returns inside every block (the days of a week for day of week, of a month for day of month and week of month, the weeks of an ISO year for week of year, the months of a year for month of year) while the labels stay where they are, and measures every state again. A real pattern is scattered over the states instead of being carried whole to another one, and each block keeps its own level of volatility, so a crisis year stays a crisis year. Shuffling inside a block does not keep the volatility clustering inside it; on simulated noise with clustered volatility the false-positive rate stayed within what the level promises (see the next paragraph). The number of shuffles is the surrogates setting (500 by default, up to 2000), with fixed seeds, so the same data and settings give the same answer.
There is one family-wide threshold: each round records the largest statistic over every tested state of every ticked dimension, and a state’s adjusted p is the share of rounds that reach its own. Ticking more dimensions can therefore only raise the bar, never lower it, and p-values are never combined across dimensions. A state survives when its adjusted p is below 0.05, the same level Market Bias uses for its studies. On simulated noise (600 fixed-seed series of eleven years, all five dimensions ticked) at least one state survived in about one series in twenty, which is what that level promises; the same held with clustered volatility. The marginal p and a Benjamini-Hochberg q over the same states are shown beside it for the vocabulary the other tabs use.
Green, amber and grey
- Green
- A state survives the family threshold, its mean is still positive after the costs on the side it leans, and the reserved range points the same way on enough units (30 dates, or 3 instances).
- Amber
- A state survives but fails one of those gates: the cost, or the reserved range disagrees or is too thin, or the state leans against the side the build trades. Without a reserved range nothing can be green; the best a state can be is amber, with the note “no held-out window”.
- Grey
- Nothing in the dimension survives, or the dimension was not run.
Each dimension shows its verdict, its best state, the side it leans, the net per trade and the q. Under it is the full table in calendar order, so you can see the shape: n, mean, net, t, q, lean and whether the reserved range agrees, with a bar for the mean of each state.
Limits
- A calendar pattern that survives is a lead to test, not a strategy. It is a measured tendency on past dates at this entry and exit, not a profit forecast. Calendar effects often vanish out of sample: that is what the reserved range is for, and a result without one cannot be green.
- Few instances. Month of year rests on one instance per year, so eleven years is eleven numbers per month. That is enough to see a large effect and not a small one; week of year has the same problem with fifty-three states.
- Grey is not “no effect”. The test is one family over fifty-odd states drawn from a few years, so it finds large effects and misses small ones. In simulated series of eleven years of weekday dates (the numbers are the share of twenty fixed-seed series in which the planted state survived), a March of half a daily standard deviation was found in all twenty, a Monday of a quarter in seventeen, and an ISO week of three quarters in nineteen, of half in fifteen and of two fifths in seven. A dimension that stays grey is inconclusive about anything smaller than that.
- Day of week and day of month. Their unit is the date, so they have the most observations, but they also have the most states to pay for (seven and thirty-one). A grey weekday or day of month is inconclusive, not a finding that no day matters.
- One trade per date means the result says nothing about the intraday shape of the effect; use Time Windows for that.
- Weekly and longer bars have no trading date and are refused. Exchange holidays and early closes are not modelled; very short dates are left out as described above.
Style Fit
Press Run style analysis. It asks one question: which trading style’s building blocks find better bars on this symbol and timeframe?
Which trading style fits?
A style here is a set of building blocks: the signal and indicator conditions a Builder search would draw on for that kind of strategy. Seven sets are scored: Breakout, Counter Trend, Mean Reversion, Momentum, Range Bound, Trend Following and Volatility. Each set’s conditions are run one at a time as entry filters over the module’s holding period, roughly 160 distinct conditions, each evaluated once and credited to every style that enables it. The styles are ranked by enrichment: the style’s survival rate divided by the survival rate across every condition tested, so a value above 1 means the surviving conditions are concentrated in that style. This takes longer than the other analyses.
- Conditions
- Exceeds the block count because a threshold block is one condition per level: RSI above 30, above 50 and above 70 are three different things to put in a strategy.
- Survive
- How many of the style’s conditions survive correction: a false-alarm risk (q) below 0.25, the same selection bar Block Edge uses. The correction is applied once across the union of all sets, so a small set does not clear a lower bar.
- Enrichment
- The style’s survival rate divided by the survival rate across every condition tested. Above 1 means the edge on this instrument is concentrated in this style. It counts survivors and has no opinion about direction.
- Strongest condition, Its edge
- The best single condition and the size of its edge over the bars it rejects, with the side it pays on beside it. It is deliberately not a signed number, because a condition selecting bars that fall is exactly as useful as one selecting bars that rise. That is why the most enriched style can lead with a short-side condition: a short edge is a reason to build the short side.
- Click a style
- Opens its detail: P&L, hit rate and the same hour, weekday, month, regime and prior-bar breakdown, but compared against that style’s other signal bars rather than the whole market, so the market’s own hour-of-day pattern does not contaminate the answer to “when does this style work”.
If styles tie, the tab says “These styles are tied, not ranked” rather than inventing an order. Blocks that could not be evaluated are listed with the reason. The scope section at the bottom names the style sets used and how the traded timeframe maps to the set variant.
Read the ranking as a place to start. The blocks inside a style are correlated: four MACD conditions are four views of one indicator, not four independent trials, so enrichment is descriptive and a formal p-value on a style would be too optimistic. Nothing here charges a stop, a target or sizing, and it does not test a finished strategy. The top style is called decisive only when its enrichment is at least 1.5, it has at least three survivors, and its enrichment is at least 1.3 times the runner-up’s; otherwise the lead is narrow and the runner-up is a close alternative. Scores use the in-sample bars only. When bars are reserved on the Data tab, each style block shows its direction on them; that checks direction, not significance, and a reversal is a warning.
AlphasWorth styles
If other products are installed, extra families can appear in a separate table (Style, Product, Installed, Licensed, Status). These are corrected and ranked among themselves, not against the seven styles, because adding them to that comparison would change every style’s q. They are analysis only: Deploy switches on blocks a task already lists, and no style set lists these, so use the matching random groups in a template build. A style is scored only when its blocks are installed and its product is licensed on this machine.
Block Edge
Press Scan all blocks. It tests every block SQX has, including any you add. Everything tested raises the bar the others must clear, so a longer range finds more that survive.
What is measured
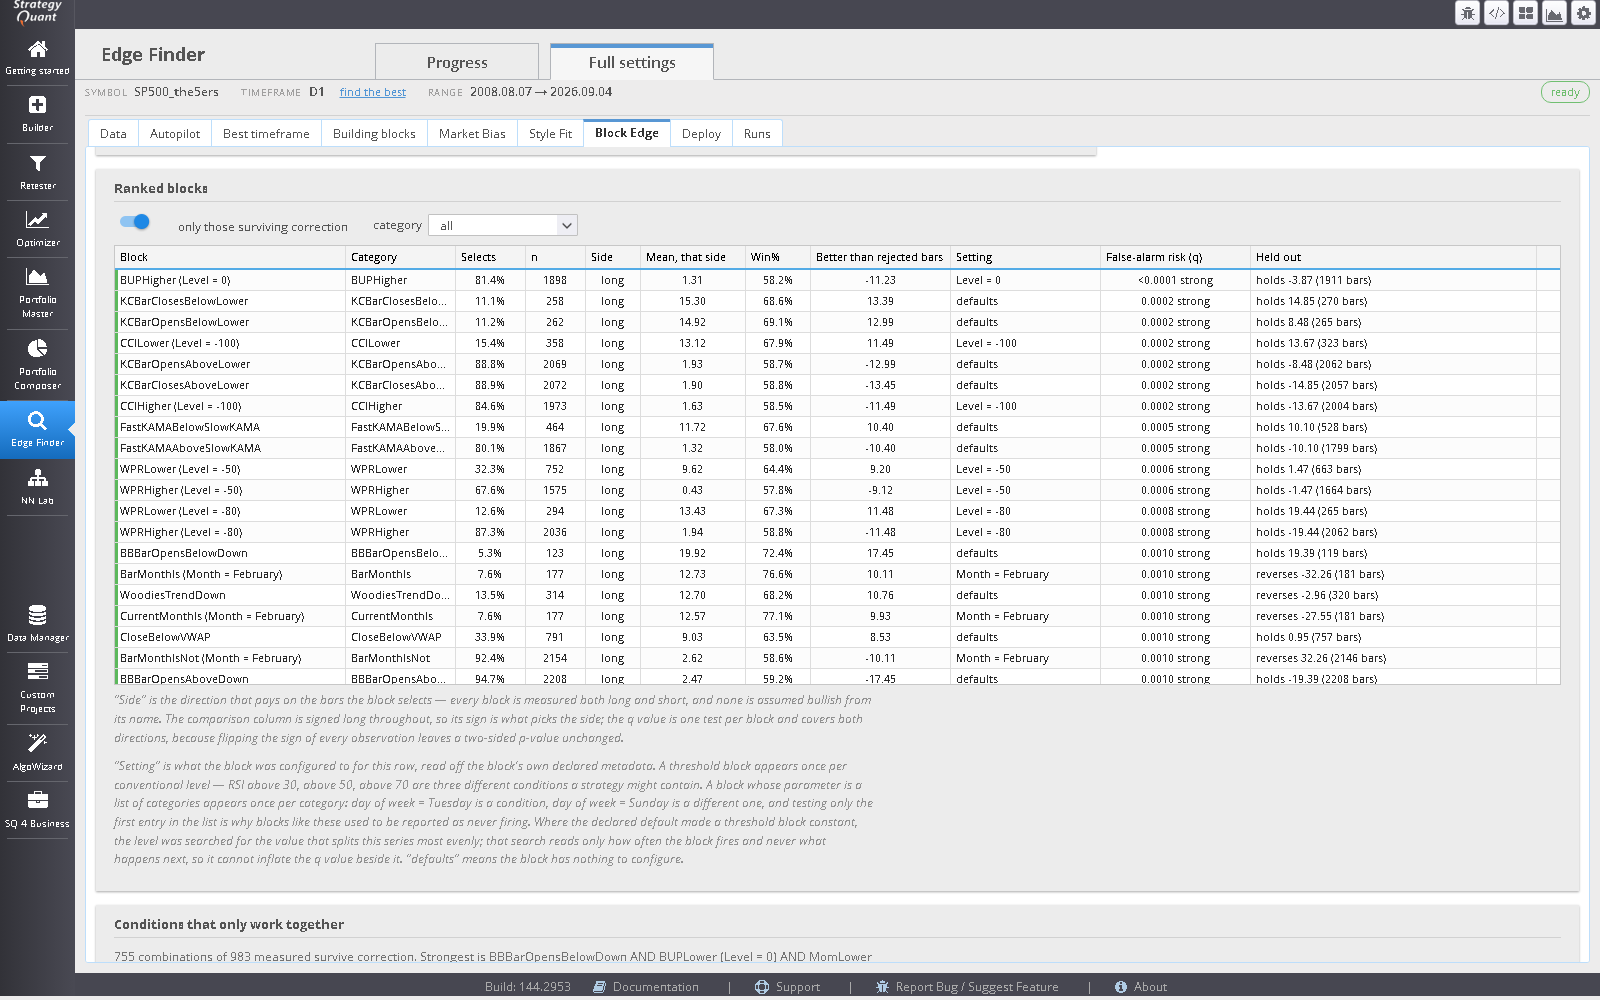
- Signals (condition blocks with a true/false answer) are used one at a time as an entry filter and scored on the bars they select against the bars they reject.
- Indicators are split at five fixed quantiles of their own distribution (the 20th, 35th, 50th, 65th and 80th percentiles) and each split scored the same way. The rule is the same on every instrument and fixed before any return is looked at, so it is a measuring instrument and not a fitted threshold; that is why the q beside those rows means the same as the one beside a signal. A price level (a moving average, a band) is split on how far the close sits from it, in percent, so “close vs SMA > 0.4%” reads as the condition a strategy would write.
- Each block is attempted independently and failures are reported rather than hidden. This is the one part of the module that drives SQX’s compiled blocks outside the engine that normally owns them, so the run always tells you whether the approach works on your install.
Reading the result
- Side
- The direction that pays on the bars the block selects. Every block is measured long and short and none is assumed bullish from its name.
- Better than rejected bars
- Always signed long. A negative figure means the bars the block rejects did better than the ones it selects, even when the selected bars still pay on the side shown.
- q
- One test per block, covering both directions, because flipping the sign of every observation leaves a two-sided p-value unchanged.
- Setting
- What the block was configured to for the row: RSI above 70, or day of week = Tuesday. A category-list parameter appears once per category, so Sunday is tested as well as Tuesday. Where the declared default made a threshold block constant, the level was searched for the value that splits the series most evenly; that search reads only how often the block fires and never what happens next, so it cannot inflate the q beside it. “defaults” means nothing to configure.
- In-process counts
- Evaluated, failed, timed out, constant output, non-boolean output and registry size, so you can see how much of the registry was tested.
Conditions that only work together
A one-condition-at-a-time scan cannot find a pair of blocks that pays only in company. A second table searches combinations seeded from the strongest single conditions and lists those that survive, with Selects, n, Better than the rest, Lift over best single and whether each is Minimal (every term load-bearing). Read this table; do not build directly from it. The seeds are themselves a choice made on this data and the correction does not charge for it. What reaches a deployed style set is narrower than what is listed: only combinations whose every term is load-bearing, at the stricter q < 0.10 rather than the q < 0.25 the table is read at. A fresh date range remains the confirmation.
What is left out
The strategy-control family (market position, pending orders, last order, recently closed trades) reads the strategy’s own trade history, which a scan outside a backtest does not have, so these are skipped and listed. So are blocks marked to be hidden from the builder: scoring one would be advice that cannot be taken.
Best timeframe
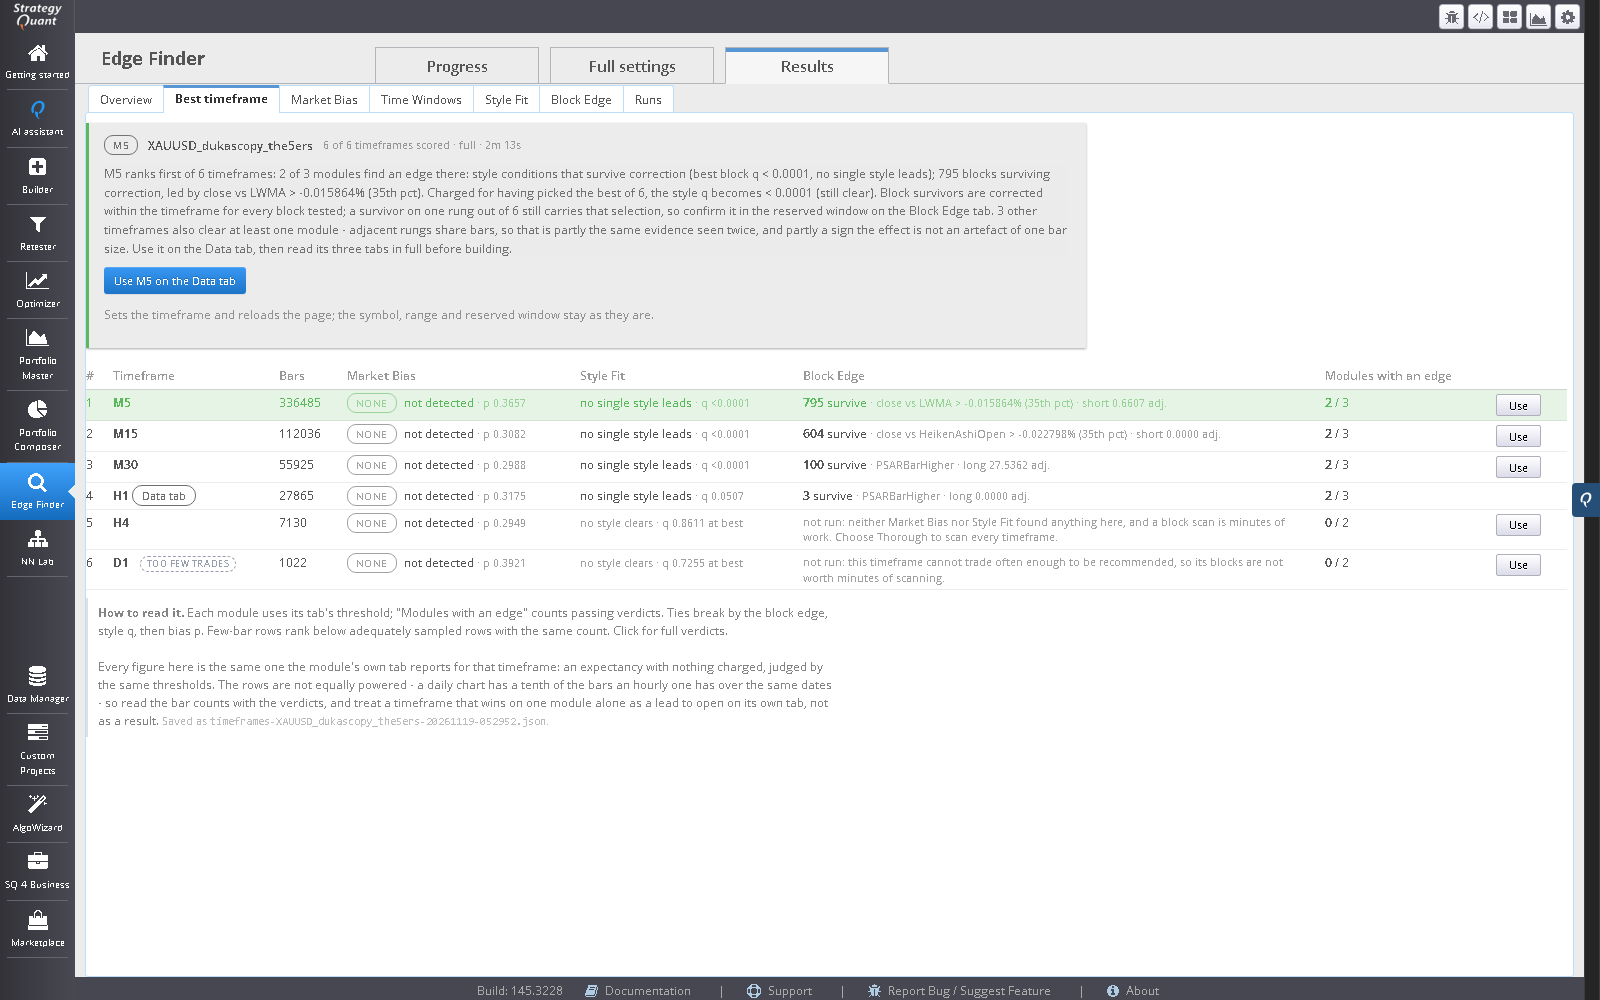
Which bar size shows an edge for this symbol? Tick the timeframes to consider (the default suggestion is a standard set; a custom timeframe you added may not appear), pick a depth, and press Find the best timeframe.
| Depth | What runs |
|---|---|
| Quick | Market Bias and Style Fit on every ticked timeframe. Seconds each. |
| Full | Then Block Edge, only on timeframes where Bias or Style found something. Minutes for each of those. |
| Thorough | Block Edge on every timeframe, and Time Windows on intraday ones, whatever the first two said. |
The result is a ranked table: rows are ranked by how many modules find an edge on them, with ties broken by the block scan’s selection-shrunk top edge, then the top style’s best-condition q, then the bias p. Each cell is that module’s own verdict, judged by its own threshold. A row with few bars is scored but sinks below a properly sampled row on the same count. The Style module counts as finding an edge on a row when some style’s conditions survive correction, that is, the best condition across the scored styles has q below 0.10, a stricter bar than the 0.25 a condition needs to survive on the Style Fit tab. Whether one style leads clearly is shown on the row but does not change that. Click a row for the three verdicts in full. Use <timeframe> on the Data tab sets the winner; it reloads the page and leaves the symbol, range and reserved window as they are.
The Tradability line on each row says about how many entry signals a year the style’s conditions produce (the floor is 24 a year); a row flagged too few trades is measured but unlikely to yield a usable strategy at that timeframe. Scans are saved and listed under Past scans with View and Delete.
Autopilot
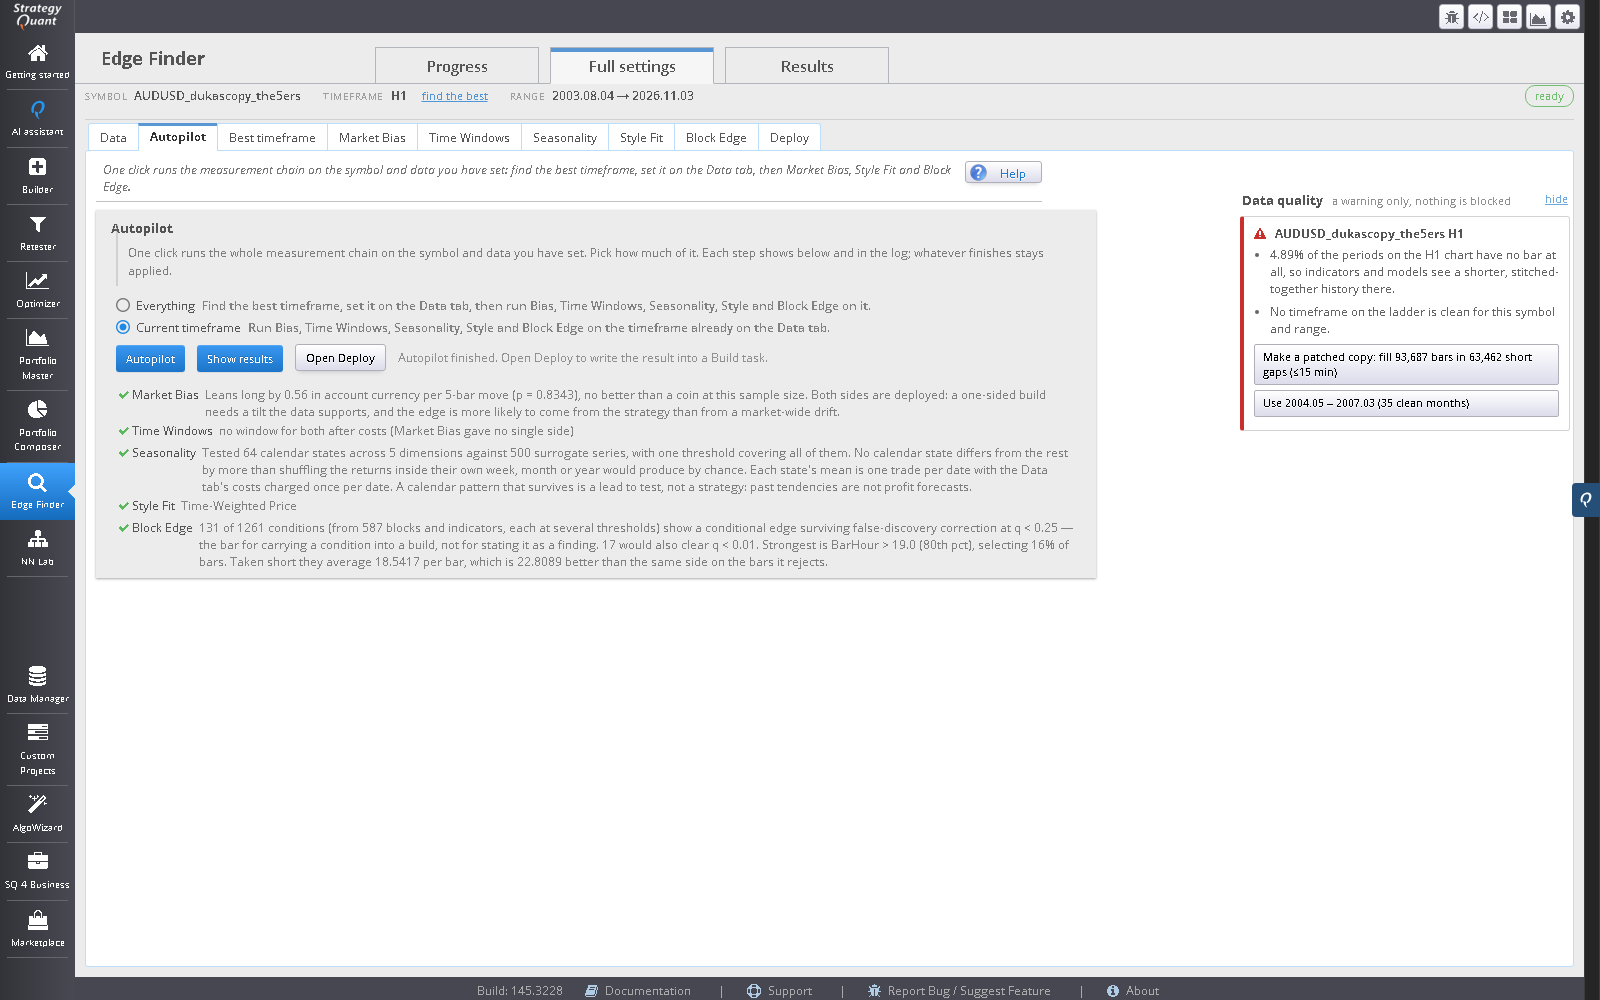
One click starts a measurement run. Pick a scope:
- Everything
- Find the best timeframe, set it on the Data tab, then run the measurement steps on it. The page reloads when the timeframe is applied; the chain resumes by itself (a state older than ten minutes is ignored, so an abandoned chain cannot wake up later).
- Current timeframe
- Run the measurement steps on the timeframe already on the Data tab.
For Everything, choose a depth (Quick, Full or Thorough, as above). The steps are Market Bias, Time Windows (skipped on daily bars), Seasonality, Style Fit and Block Edge; Seasonality runs with its default settings (all five views, the default surrogate count, the side Market Bias found), and its result is read on the Seasonality tab. Each step shows on the card and in the log, and whatever finishes stays applied. Deploy is deliberately not a step: it writes into a Build task, and which task is your decision. The card offers Open Deploy when the chain finishes.
Deploy
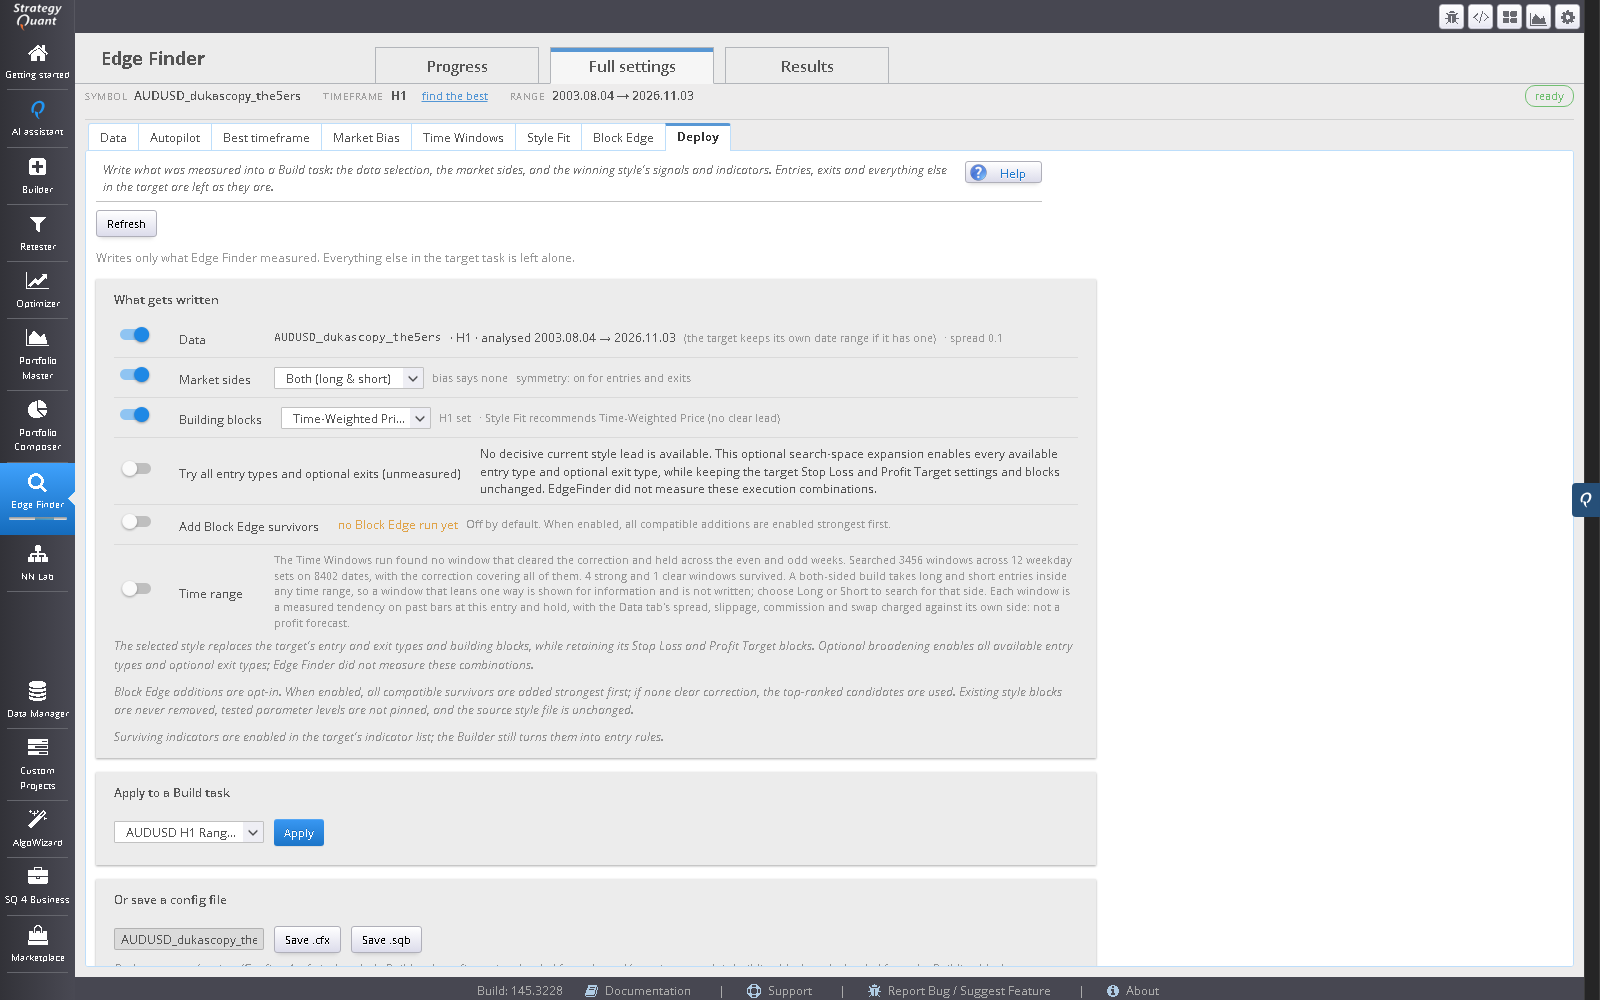
Deploy turns findings into a configured Build task. It writes what Edge Finder measured, plus the style’s own entries and exits; everything else in the target task is left alone.
What gets written
- Data
- The timeframe and the analysed range, and the spread. The target keeps its own date range if it has one.
- Market sides
- Both, Long only or Short only, pre-selected from what Market Bias found. If the bias run was on a different symbol or timeframe than the current selection, Deploy says so and asks you to re-run.
- Symmetry
- For entries and exits, decided from the bias result. With too little data to test it defaults to symmetric; with no Market Bias run it leaves the target’s setting alone.
- Time range
- Optional, off by default. The recommended Time Windows window, written to the target’s Limit time range on the data clock, including windows that cross midnight.
- Building blocks
- Choose a style; Style Fit’s recommendation is shown beside the list. You can also add Block Edge survivors on top of the style set (up to 25 extra blocks, strongest first). Surviving indicators are enabled in the target’s indicator list, because that is what an indicator finding licenses.
What is not written
- Entries and exits. These come with the style, exactly as when its block file is loaded by hand: the style’s order types, Stop and Limit entry blocks and exit types replace the target’s. The Apply result lists what the build will enter and exit with. Check it, because a style that enables one order type builds only with that one. Edge Finder itself has no finding about entry orders, stops or targets.
- Style set membership. The set’s conditions go in as they are. Style Fit chooses which set; Block Edge only turns blocks on. Removing a block on Block Edge’s evidence would use that measurement past what it supports, since a test blind to combinations cannot license dropping a block that only pays in company. Adding one risks nothing of the kind, because the builder can decline an option it was given.
- The level a block was significant at. RSI above 70 goes in as the RSI block with the parameter ranges the style set declares; the builder searches them as usual. Pinning the level would turn a measurement into a constraint and make this an optimiser.
- A weekday set. The task has no weekday filter beyond its weekend settings, so only the time range of a window is written.
- The shipped style files. The merge edits a copy held in memory and refuses to write into the styles folder.
When Block Edge survivors are few, the top-ranked few are offered instead and marked ranked, not confirmed. Either way the style you choose decides the build and the extras are options the Builder may decline.
Apply to a Build task
Choose the target project and press Apply. The project must not be running: a running task keeps the configuration it already loaded, so the write would look like it did nothing; Deploy refuses and tells you to stop it first. After writing, Deploy reads the task back from disk and reports what it now says (“Verified on disk”), and refreshes SQX’s open copy so the running application agrees with the file. If the in-memory copy does not match, it says so; the file is correct and a restart picks it up, but do not edit that task in the current session first, or the stale copy will be written back over it.
Or save a config file
Save .cfx writes the whole Build task configuration; Save .sqb writes building blocks only. Both go to user\settings\Configs. Neither is needed to Apply; they are for carrying the result to another machine.
Runs
The Runs tab lists every analysis run this session. Tick a run and press View to reopen its result (double-click also opens one) or Cancel to stop it. Clear finished tidies the list.
Settings at a glance
| Where | Setting | Default | Notes |
|---|---|---|---|
| Market Bias | Fast / slow moving average | 50 / 200 | Define the regime; apply to every analysis. |
| Market Bias | Sideways band | 0.005 | Fraction of the slow average. |
| Market Bias | Holding period | 5 bars | 1 to 500. Applies to every figure on every tab except Seasonality, where a trade is a whole trading date: there the holding period does not set the trade. It only shortens the usable range, as it does everywhere else: the last holding-period bars of the data are not signal bars, and the bars the boundary drop leaves out near a reserved range are not used. |
| Market Bias | Studies | none | Volatility regime, candle runs, sequence motifs, market structure. |
| Market Bias | Surrogates | 500 | 100 to 2000. Seeded. |
| Time Windows | Slot length | automatic | 60 minutes on H1 and above, 30 on M30, 15 on M5/M15. Or 5, 15, 30, 60, 120, 240, 360; never shorter than the bar. |
| Time Windows | Longest window | 12 hours | 1 to 24. With 5-minute slots a value above 12 is cut back to 12 (the search is capped at 500,000 windows) and the result says so. |
| Time Windows | Permutations | 1000 | 100 to 5000. Seeded: the same input gives the same answer. |
| Time Windows | Include weeks the clock audit flags | off | Weeks one hour off the declared clock are left out unless ticked. |
| Seasonality | Dimensions | all five | Day of week, day of month, week of month, week of year, month of year. |
| Seasonality | Surrogates | 500 | 50 to 2000. Seeded. |
| Seasonality | Side the build trades | from Market Bias | A state leaning against it cannot be green. |
| Best timeframe | Depth | Quick | Quick, Full or Thorough. |
| Autopilot | Scope | Everything | Or Current timeframe. |
| Deploy | Block Edge survivors | optional | Adds up to 25 blocks to the chosen style. |
| All analyses | False-discovery level | q < 0.10 | Accepted rows are strong or clear. |
Limits
- Costs are shown beside the move. The direction is read from the gross move. The Data tab’s spread, slippage, commission and swap are set against it in separate cost and net columns on Market Bias, in a Net per trade column on Time Windows and in a cost line on Block Edge. If the Data tab holds none, none are charged. Stops, targets and sizing are not modelled.
- Fixed-hold measurement only. Edge Finder has no finding about stops, targets, trailing exits or position sizing.
- Choices between runs are not corrected. Correction controls false discoveries within a table, not the choices you make between runs (changing the holding period after seeing the hold curve, trying five timeframes). A fresh date range is the confirmation.
- Past, not future. A measured tendency describes the history you gave it.
- One symbol at a time. A finding on one instrument says nothing about another, and the Deploy panel flags results measured on a different symbol.
Troubleshooting
| Symptom | Cause and fix |
|---|---|
| Time Windows says the clock is unknown | The dataset declares no timezone SQX can resolve. Type the zone into Data clock (for example UTC, UTC+2, EETUS or Europe/London). Until then windows are shown on the data clock only. |
| Time Windows says it needs intraday bars | A daily bar has no time of day. Pick H4 or shorter on the Data tab. |
| Apply says the project is running | Stop the project first. A running task keeps its loaded configuration. |
| “No bars are reserved” | Add an out-of-sample range under Data range parts on the Data tab. Until you do, nothing is checked against data it did not help choose. |
| Fixed-date reserved ranges hit another symbol | A fixed-date reserved range applies to whatever symbol is selected. Check the range on the Data tab after changing symbol. |
| A block you expected is missing from Block Edge | It may be in the “could not be evaluated” list (strategy-control family, hidden-from-builder blocks) or marked constant output. The reason is given per block. |
| Style Fit says “tied, not ranked” | The styles are not distinguishable on this data. Use a longer range. |
| The page reloads during Autopilot | Expected when the best timeframe is applied; the chain resumes by itself. |
| Deploy cannot find the target | Edge Finder and NN Lab projects are not offered as targets. Choose a project with a Build task. |
| The tab is blank after an update | Restart SQX. Plugins are loaded only at start. |